


.svg)








Chiller Plant Optimisation: A Step-by-Step Energy Audit Guide
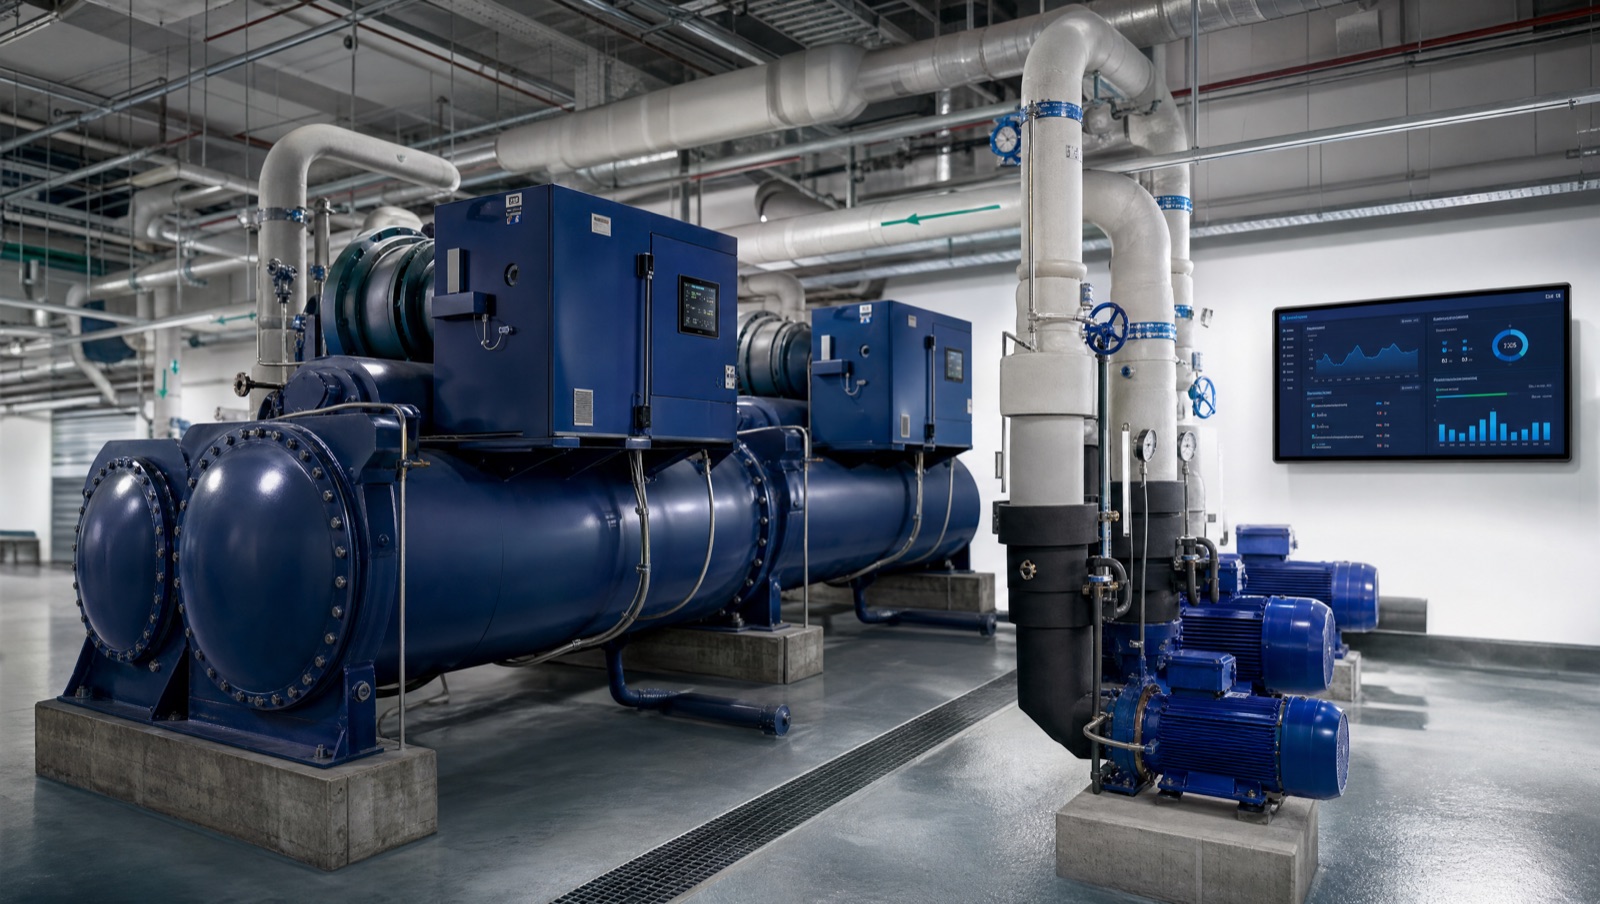
Chiller plant optimisation is usually the highest-return energy project available to a commercial building operator in Singapore. Air conditioning takes the largest single share of a tropical building's electricity bill, and most plants run below their design efficiency because of control logic rather than mechanical fault. This guide sets out a five-step energy audit that locates the losses, quantifies the opportunity, and defines a scope of works you can verify after commissioning.
Why the Chiller Plant Is the Highest-Value Audit Target
In an equatorial climate there is no heating season and no real shoulder season, so a single percentage point of plant efficiency compounds across more than 8,000 operating hours a year. Two characteristics make the plant a productive target for chiller plant optimisation.
First, a chiller plant is a system, not a machine. Efficiency is decided by the interaction of five interdependent subsystems: cooling towers, condenser water pumps, chillers, chilled water pumps, and air handling units. A high-efficiency chiller still delivers poor plant-level performance if condenser water temperature is never reset, differential pressure is held too high, or machines are staged on a fixed sequence instead of on measured load.
Second, most of the recoverable loss sits in controls rather than hardware. Our chiller plant optimisation approach layers sensors and control logic onto the existing mechanical plant, so a building can act without waiting for a capital replacement cycle. Variable frequency drives are needed on ancillary equipment (chilled water pumps, condenser water pumps, cooling tower fans), but the chiller compressors can remain fixed-speed.
The Five-Step Chiller Plant Energy Audit
Step 1: Establish a measured baseline in kW/RT
Every chiller plant optimisation project starts here. Plant-level kilowatts per refrigeration tonne (kW/RT) is the working metric, and it needs simultaneous measurement of total plant electrical input (chillers plus pumps plus tower fans) and delivered cooling (chilled water flow with supply and return temperature differential). Nameplate figures and utility bills are not a baseline. Log at one to fifteen minute intervals across two to four weeks, so the dataset covers weekday peak, weekend, and low-load overnight operation. Without that spread you cannot separate an efficiency problem from an occupancy pattern.
Step 2: Meter all five subsystems, not just the chillers
An audit that meters only the chillers mis-attributes loss, because pumps and cooling tower fans often carry more avoidable consumption than the compressors. A workable instrumentation set covers:
- BTU metering on the chilled water loop (flow plus supply and return temperature)
- Electrical metering per chiller and per pump group rather than one plant total
- Condenser water supply and return temperature, plus cooling tower approach against wet-bulb
- Air handling unit valve positions and served space conditions
- Outdoor wet-bulb, so performance can be normalised against weather
Where a building already runs energy monitoring, most of these points can be pulled from the existing platform. Where it does not, HVAC monitoring is installed as part of the audit and retained for continuous verification. Density is what makes plant-level analysis work at scale: our MediaCorp deployment runs more than 1,000 panel meters and 130 data loggers on PecStar® iEMS.
Step 3: Analyse part-load behaviour and chiller lift
Design-day full load is the exception, not the rule. For most buildings outside the data centre sector, part load is the dominant condition and where audits find the largest gaps. Three patterns recur across Singapore sites, and each should be quantified from logged data rather than a walk-through, then ranked in kW/RT terms:
- Two or three chillers running at low percentage load where one machine would be more efficient
- System differential pressure pinned at a fixed high setpoint to satisfy one hydraulically distant coil
- Condenser water temperature never reset downward when wet-bulb allows, leaving chiller lift higher than it needs to be
Step 4: Define the control strategy and state the prerequisites
The strategy is site-specific, but the components are consistent: chiller staging against measured load, chilled water and condenser water temperature reset, decoupled primary-secondary flow, and cooling tower fan staging against approach temperature. An honest audit also lists the mechanical prerequisites, since these set cost and programme: VFDs on ancillary equipment, three-way air handling unit valves converted to two-way so the secondary loop can genuinely vary flow, and sensors the original design omitted.
Our control approach is chiller-brand agnostic and integrates over BACnet or Modbus TCP/IP, so it normally deploys alongside an existing building management system rather than replacing it, and installs as a retrofit without voiding equipment warranties.
Step 5: Commission with measurement and verification built in
Verification must compare like with like: kW/RT at matched cooling load and matched outdoor wet-bulb, not raw monthly kilowatt-hours, which move with occupancy and weather whatever the controls do. A typical mid-size plant of 500 to 2,000 RT commissions in six to twelve weeks, covering baseline measurement, control deployment, verification under varying load, and operator training. Keep the metering afterwards, because gains erode quietly when setpoints get overridden during a hot week and nobody watches the trend.
What Chiller Plant Optimisation Typically Delivers
System-level kW/RT typically improves by 10 to 25 percent, with the range driven by how mature the existing controls are. A plant with no reset strategies and fixed-speed ancillaries has more to recover than one already running a partially tuned sequence. The largest single contributor is usually correct chiller staging combined with decoupled primary and secondary flow, so differential pressure sits at the right level rather than the highest level. Gains under part load generally exceed gains at design-day full load, which is the useful way round, because part load is where the operating hours accumulate.
There is a maintenance dividend too. Correct staging reduces compressor start-stop cycling, and stable differential pressure reduces hydraulic stress on pumps and control valves. Where the same metering feeds a condition monitoring system, degradation trends on pumps and motors surface before they become failures.
How the Audit Feeds Green Mark and Carbon Reporting
A chiller plant optimisation audit produces exactly the evidence Singapore's reporting regimes ask for. BCA Green Mark scoring rewards demonstrated plant efficiency rather than specified equipment ratings, and measured kW/RT under real load is the strongest form of that evidence. Under the Carbon Pricing Act 2019 the carbon tax stands at $25 per tonne, rising toward $80 per tonne by 2030, so avoided kilowatt-hours carry growing balance-sheet value for facilities above the 25,000 tonne threshold. ACRA and SGX sustainability reporting requirements, mandatory for listed issuers from FY2025 and extending to large non-listed companies from FY2027, mean the metering installed for optimisation also supports auditable Scope 2 disclosure. ISO 50001 expects the same cycle: baseline, act, verify.
This is where an audit stops being a one-off exercise. Feeding chiller plant data into an energy management system sets plant efficiency alongside the rest of the building's energy picture, so one dataset serves operations, Green Mark submission, and carbon reporting.
Book a Chiller Plant Assessment
EcoXplore is headquartered in Singapore with engineering teams across five ASEAN markets, and holds ISO 9001:2015, ISO 45001:2018, BCA ME02 L4, and BizSAFE Star certification alongside GeBiz listing. We deliver chiller plant optimisation end-to-end: baseline measurement, control strategy design, deployment, and verified handover. Contact our engineering team to scope a baseline measurement period and a realistic savings target for your plant.


More About Ecoxplore
We are dedicated to empowering businesses with software and services that drive efficiency and growth
View more

.svg)

.svg)

.svg)
.svg)

More About Ecoxplore
We are dedicated to empowering businesses with software and services that drive efficiency and growth
View moreข้อมูลเพิ่มเติมเกี่ยวกับ Ecoxplore
เรามุ่งมั่นในการช่วยให้ธุรกิจของคุณทำงานได้อย่างมีประสิทธิภาพและเติบโตอย่างยั่งยืนด้วยซอฟต์แวร์และบริการของเรา
ดูเพิ่มเติมMore About Ecoxplore
We are dedicated to empowering businesses with software and services that drive efficiency and growth
View moreLebih Banyak Tentang Ecoxplore
Kami berdedikasi untuk memberdayakan bisnis dengan perangkat lunak dan layanan yang mendorong efisiensi dan pertumbuhan
Lihat lebih banyakMore About Ecoxplore
We are dedicated to empowering businesses with software and services that drive efficiency and growth
View moreLebih Banyak Tentang Ecoxplore
Kami berdedikasi untuk memberdayakan bisnis melalui perangkat lunak dan layanan yang mendorong efisiensi serta pertumbuhan.
Lihat selengkapnyaMore About Ecoxplore
We are dedicated to empowering businesses with software and services that drive efficiency and growth
View moreHiểu thêm về Ecoxplore
Chúng tôi cam kết trao quyền cho các doanh nghiệp bằng phần mềm và dịch vụ giúp tăng cường hiệu quả và phát triển
Xem thêm