


.svg)





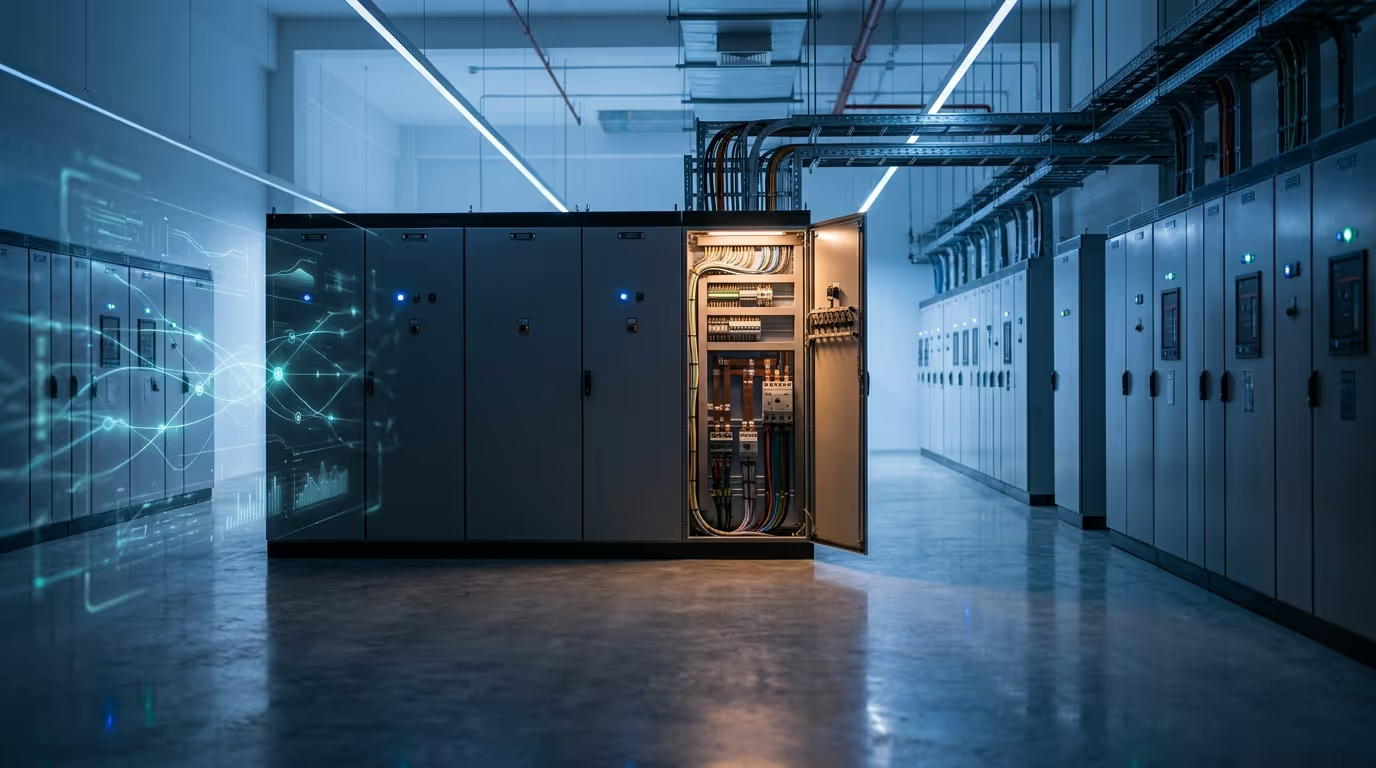


Data Centre Power Quality Monitoring: Harmonics, THD Limits and IEC 61000-4-30 in Singapore Facilities
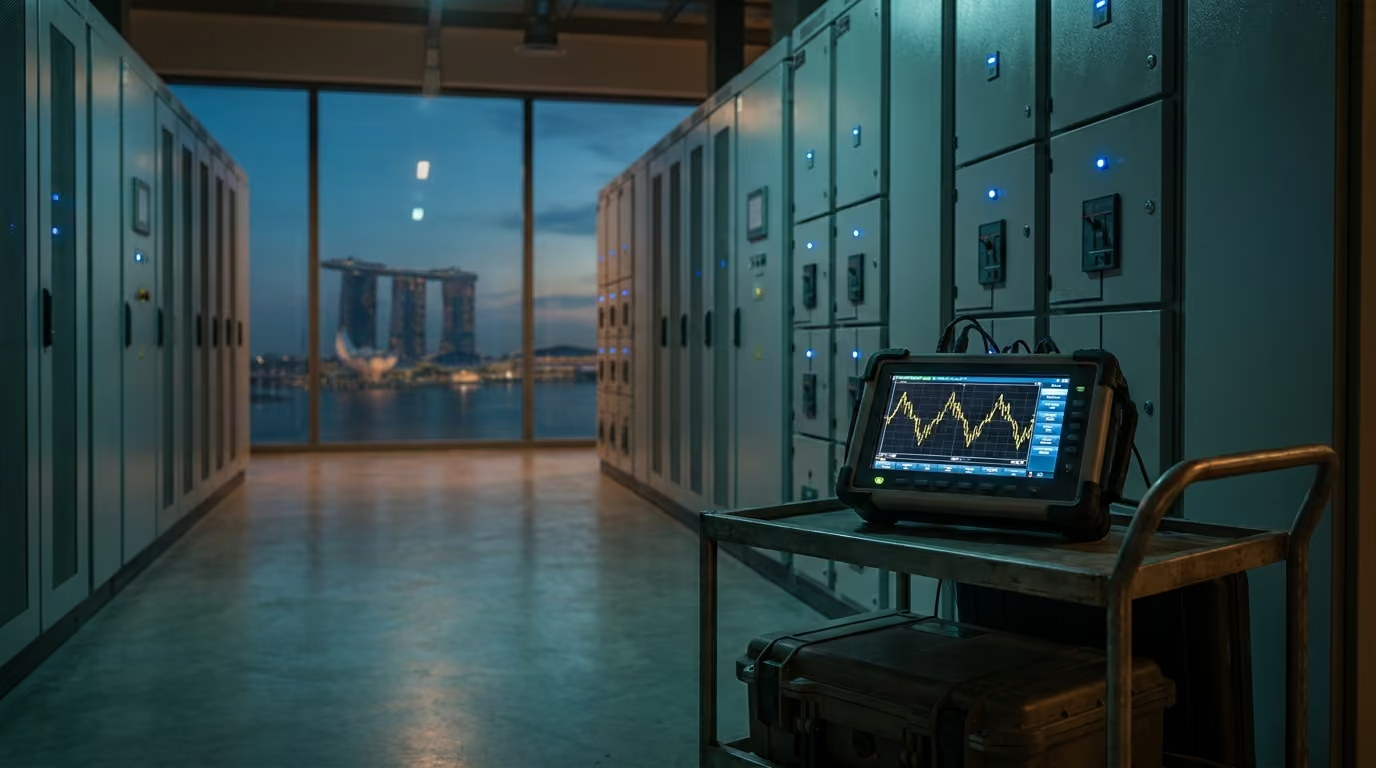
Singapore hosts more than 70 operational data centres and is on track to add another 300 MW of certified capacity under the 2024 Data Centre - Call for Application. Every additional megawatt sits behind switchgear that is increasingly polluted by harmonic currents, voltage notches and transient events. Yet most facility teams still rely on the basic energy meter built into their main switchboard. That is enough to bill for kilowatt-hours; it is nowhere near enough to protect uptime or defend a PUE target.
This guide explains what a purpose-built data-centre power quality monitoring system (PQMS) measures, which standards anchor those measurements, and where to install sensors so the data is actually useful. It is written for the facility manager or M&E lead who needs to specify, retrofit or audit a PQMS before the next utility audit or BCA submission.
1. Why data centres are uniquely exposed to power quality issues
A data centre electrical system is a textbook non-linear load. The two dominant loads - UPS rectifiers and IT switch-mode power supplies - draw current in narrow pulses near the peak of the voltage waveform. The result is a current waveform rich in odd harmonics (3rd, 5th, 7th, 11th, 13th).
- Heat in transformers and cables. Harmonic currents add I²R losses without delivering real power. A 5% increase in current total harmonic distortion (THD-I) can lift transformer losses by 15–25%.
- Neutral overloading. Triplen harmonics (3rd, 9th, 15th) do not cancel in the neutral conductor; they sum. Many data-centre risers run undersized neutrals dating from the era before high-frequency SMPS loads dominated.
- Capacity loss. Switchgear nameplate ratings assume sinusoidal current. A switchboard rated 2 000 A may only deliver 1 700 A of usable IT capacity once harmonic derating is applied.
- Nuisance breaker trips. Voltage notches and sub-cycle transients trigger ground-fault and arc-fault devices that are otherwise silent under linear load.
None of these failure modes are visible on a kilowatt-hour meter. They appear only when current and voltage are sampled fast enough to resolve harmonic content - typically at 128 samples per cycle or higher - and aggregated according to a recognised standard.
2. What "good" looks like: THD, IEEE 519 and IEC 61000-4-30 Class A
Two standards define the rules of the game.
IEC 61000-4-30:2015 (Class A) specifies how a power quality instrument must measure - its accuracy, time aggregation (3 s, 10 min, 2 h), and flagging behaviour during disturbances. A Class A instrument from one vendor must produce statistically identical results to a Class A instrument from another vendor on the same waveform. Anything below Class A (Class S or Class B) is acceptable for trending but should not be used for compliance reporting or contractual evidence.
IEEE 519-2022 defines what the numbers should be. At the point of common coupling (PCC) with the utility:
| Parameter | Limit (typical LV data centre) | Why it matters |
|---|---|---|
| Voltage THD (THD-V) | ≤ 5% | Above 5% degrades sensitive electronics and trips UPS bypass |
| Individual voltage harmonic | ≤ 3% | Resonance risk at 5th and 7th |
| Current TDD at PCC | ≤ 8% (depends on Isc/IL ratio) | Utility may impose penalties or refuse new connection |
| Voltage unbalance | ≤ 2% | Above 2% accelerates three-phase IT PSU failure |
| Frequency deviation | ± 1% of 50 Hz | Outside this, UPS rejects mains and runs from battery |
If a PQMS does not flag breaches of these thresholds automatically, it is not doing its job. A standards-anchored Power Quality Monitoring System (PQMS) should produce IEC 61000-4-30 Class A reports without manual export and post-processing.
3. The seven parameters a data-centre PQMS must log
- RMS voltage and current per phase aggregated at 3 s, 10 min and 2 h. The 10-min aggregation is the legal evidence for utility disputes.
- Voltage and current THD with individual harmonic spectrum up to the 50th order. Limit yourself to the 25th order only if the PQMS cannot store more - but you will miss switching-frequency harmonics from VFD-driven chillers.
- Voltage and current unbalance using the symmetrical components method (true negative-sequence ratio), not the simple max-minus-average approximation.
- Flicker (Pst and Plt) per IEC 61000-4-15. Less critical for IT load but essential when a data centre shares an MV feeder with a manufacturing tenant.
- Rapid voltage changes, sags and swells with cycle-by-cycle detection. ITIC and SEMI F47 curves should be auto-overlaid on the event log.
- Transients and impulses down to sub-microsecond resolution at critical points (UPS input, transfer switch). This is what separates a PQMS from a basic power meter.
- Active, reactive and apparent power per phase with true power factor and displacement power factor reported separately. Confusing the two is the most common cause of wrong capacitor-bank sizing.
For a deeper comparison of monitoring scope, see our breakdown of EMS vs PQMS - energy management focuses on consumption, PQMS focuses on quality and reliability.
4. How harmonics quietly erode PUE and IT capacity
A worked example: a 2 MW IT-load data centre running at 8% THD-I across its UPS inputs.
- Transformer losses rise by approximately 18% versus the sinusoidal case - roughly 22 kW of additional waste heat.
- That heat must be removed by the CRAC/CRAH plant. At a typical mechanical efficiency of 3.5 COP, the cooling penalty is another 6.3 kW of electrical input.
- Total preventable load: ~28 kW continuous, or about 245 MWh per year.
- At a commercial-tariff blended rate of S$0.28/kWh, that is roughly S$68 600 per year in avoidable cost - before the PUE penalty.
- The same harmonic load derates a 2 500 kVA transformer by about 12%, equivalent to losing 300 kVA of usable IT growth headroom.
None of this appears on the energy bill as a separate line. It hides inside the kilowatt-hour total. A PQMS surfaces it explicitly and lets the operations team build a remediation business case - typically filters or active harmonic conditioners with a 2–3 year payback at this scale.
5. Where to instrument: MSB, UPS, PDU and downstream
Sensor placement matters more than sensor count. A minimum data-centre instrumentation set covers four layers:
- Main switchboard (MSB) incomer - the legal point of common coupling with the utility. Class A meter; this is the device whose data will be cited in any dispute or BCA submission.
- UPS input and output - the input meter quantifies the harmonic burden the data centre presents upstream; the output meter quantifies the quality delivered to IT. The delta is the value the UPS adds.
- PDU and busway tap-offs - branch-circuit monitoring (BCM) at the rack feed. This is where stranded capacity becomes visible.
- Standby generator and ATS - capture transfer events with sub-cycle resolution. Most undiscovered IT outages trace back to a flawed transfer here.
An informal rule of thumb: one Class A instrument per voltage transition (MV → LV → UPS → PDU) and one Class S or Class B device per downstream branch. Trying to make a single instrument cover everything either over-spends at the rack or under-instruments at the incomer.
6. Bridging PQMS to DCIM and BMS for unified visibility
A PQMS that lives on its own laptop helps nobody. Modern instruments expose Modbus TCP, IEC 61850 GOOSE, MQTT and BACnet/IP simultaneously, allowing the same dataset to feed three different consumers:
- DCIM for capacity planning and rack-level chargeback - the PQMS contributes the "real" usable current after harmonic derating.
- BMS for alarm escalation through the existing 24/7 console - facility teams should not need a new pane of glass.
- Sustainability / ESG reporting - power quality data feeds Scope 2 reporting refinement and supports SS 564 (Singapore Standard for energy management) submissions.
This is where the integration architecture earns its keep. EcoXplore's DCIM and energy monitoring solutions are designed so PQMS data lands in the same store as cooling, IT-load and BMS telemetry - without screen-scraping or one-off integrations.
7. Singapore compliance: SS 638, BCA Green Mark and the EMA framework
Three local frameworks shape what a data-centre PQMS must produce:
- SS 638:2018 (the Singapore Code of Practice for electrical installations) requires harmonic assessment for any installation with significant non-linear load - every modern data centre qualifies.
- BCA Green Mark for New Data Centres awards points for sub-metering granularity and real-time monitoring of electrical reticulation. See our companion piece on BCA Green Mark energy monitoring for the submetering hierarchy.
- EMA Quality of Supply Code defines the voltage and frequency envelopes the utility must deliver - and, by extension, the envelopes a data centre can contractually rely on. A Class A PQMS at the PCC is the only evidence acceptable in a dispute.
Operators serving regulated tenants - banks under MAS TRM, healthcare under MOH, government under IM8 - should add data-integrity controls on the monitoring system itself. EcoXplore's monitoring platform is built on an ISO 27001:2022-certified Information Security Management System, so the chain-of-custody of measurement data is auditable end-to-end.
8. Action checklist for facility managers
- Confirm whether your existing meter is IEC 61000-4-30 Class A. If it is not, the data it produces cannot defend a utility dispute.
- Locate sensors at the MSB incomer, UPS input, UPS output and at least one representative PDU.
- Configure 10-minute aggregation as the legal record; keep 3-second and waveform-capture buffers for forensic events.
- Set alarm thresholds against IEEE 519-2022 voltage and current limits, not vendor defaults.
- Pipe PQMS data into the same store as DCIM, BMS and energy submeters - silos defeat the purpose.
- Review the harmonic profile quarterly. Loads change as IT density grows; thresholds set at commissioning will drift.
Talk to the team
EcoXplore designs and deploys IEC 61000-4-30 Class A power quality monitoring across Singapore and Southeast Asia, integrated with DCIM, BMS and energy management platforms. If you are planning a new build, a Green Mark recertification, or a remediation after a near-miss, talk to our team - most engagements start with a one-day walk-through and a measurement-point map.

数据中心电能质量监测:新加坡设施中的谐波、THD 限值与 IEC 61000-4-30
新加坡拥有超过 70 座在运营的数据中心,并按照 2024 年数据中心招标计划(Data Centre - Call for Application)有望再新增 300 MW 的认证产能。每新增一兆瓦,都隐藏在日益受到谐波电流、电压陷波和瞬态事件污染的开关设备之后。然而,大多数设施团队仍依赖主配电柜中内置的基本电能表。这足以按千瓦时计费,但远不足以保护正常运行时间,也远不足以守住 PUE 目标。
本指南阐述一套专为数据中心打造的电能质量监测系统(PQMS)测量哪些内容、哪些标准为这些测量提供依据,以及应在何处安装传感器才能让数据真正有用。本文面向需要在下一次公用事业审计或 BCA 提交之前规范、改造或审核 PQMS 的设施经理或机电(M&E)负责人。
1. 为何数据中心在电能质量问题上格外脆弱
数据中心电气系统是典型的非线性负载。两类主导负载(UPS 整流器和 IT 开关电源)都在电压波形峰值附近以窄脉冲方式取电。其结果是富含奇次谐波(3 次、5 次、7 次、11 次、13 次)的电流波形。
- 变压器和电缆发热。谐波电流增加 I²R 损耗而不输出有功功率。电流总谐波畸变(THD-I)每上升 5%,可使变压器损耗增加 15–25%。
- 中性线过载。三倍频谐波(3 次、9 次、15 次)在中性线导体中不会相互抵消,而是叠加。许多数据中心的竖向母线沿用了高频 SMPS 负载占主导之前那个年代的中性线,截面偏小。
- 容量损失。开关设备的铭牌额定值假设电流为正弦波。一台额定 2 000 A 的配电柜,在施加谐波降额后可能只能提供 1 700 A 的可用 IT 容量。
- 断路器误跳闸。电压陷波和次周波瞬态会触发接地故障和电弧故障保护装置,而这些装置在线性负载下本应保持静默。
这些失效模式在千瓦时电能表上均不可见。只有当电流和电压的采样速度足够快、能够分辨谐波成分(通常为每周波 128 个采样点或更高),并按公认标准进行聚合时,它们才会显现出来。
2. “良好”的标准是什么:THD、IEEE 519 与 IEC 61000-4-30 Class A
有两项标准界定了这场博弈的规则。
IEC 61000-4-30:2015(Class A)规定电能质量仪表必须如何测量,包括其精度、时间聚合(3 秒、10 分钟、2 小时)以及在扰动期间的标记行为。某一厂商的 Class A 仪表,在同一波形上必须产生与另一厂商的 Class A 仪表在统计上一致的结果。任何低于 Class A 的等级(Class S 或 Class B)可用于趋势分析,但不应用于合规报告或合同证据。
IEEE 519-2022界定这些数值应该是多少。在与公用电网的公共连接点(PCC)处:
| 参数 | 限值(典型低压数据中心) | 为何重要 |
|---|---|---|
| 电压 THD(THD-V) | ≤ 5% | 超过 5% 会损害敏感电子设备并触发 UPS 旁路 |
| 单次电压谐波 | ≤ 3% | 5 次和 7 次谐波存在谐振风险 |
| PCC 处电流 TDD | ≤ 8%(取决于 Isc/IL 比值) | 公用事业方可能施加罚款或拒绝新接入 |
| 电压不平衡 | ≤ 2% | 超过 2% 会加速三相 IT 电源故障 |
| 频率偏差 | 50 Hz 的 ± 1% | 超出此范围,UPS 将拒绝市电并切换至电池供电 |
如果一套 PQMS 不能自动标记对这些阈值的违反,那它就没有尽到本职。一套以标准为依据的电能质量监测系统(PQMS)应能在无需人工导出和后处理的情况下生成 IEC 61000-4-30 Class A 报告。
3. 数据中心 PQMS 必须记录的七项参数
- 每相 RMS 电压和电流,按 3 秒、10 分钟和 2 小时聚合。10 分钟聚合是公用事业纠纷中的法律证据。
- 电压和电流 THD,含直至 50 次的单次谐波频谱。只有在 PQMS 无法存储更多时才将自己限制在 25 次以内,但那样你将错过变频器(VFD)驱动冷水机组的开关频率谐波。
- 电压和电流不平衡,采用对称分量法(真实的负序比值),而非简单的最大值减平均值的近似法。
- 闪变(Pst 和 Plt),依据 IEC 61000-4-15。对 IT 负载而言不那么关键,但当数据中心与制造业租户共用一条中压馈线时则至关重要。
- 电压快速变化、暂降和暂升,具备逐周波检测能力。事件日志上应自动叠加 ITIC 和 SEMI F47 曲线。
- 瞬态和冲击,在关键点(UPS 输入、转换开关)处可达亚微秒级分辨率。这正是 PQMS 区别于基本电能表之处。
- 每相有功、无功和视在功率,分别报告真实功率因数和位移功率因数。混淆二者是电容器组选型出错最常见的原因。
如需更深入地比较监测范围,请参阅我们对 EMS 与 PQMS 对比的剖析:能源管理关注消耗,PQMS 关注质量与可靠性。
4. 谐波如何悄然侵蚀 PUE 和 IT 容量
举一个具体算例:一座 2 MW IT 负载的数据中心,其各 UPS 输入端的 THD-I 为 8%。
- 相较于正弦工况,变压器损耗约上升 18%,约合 22 kW 的额外废热。
- 这些热量必须由 CRAC/CRAH 设备移除。按典型的机械效率 3.5 COP 计算,制冷代价又需另外 6.3 kW 的电力输入。
- 可避免的总负载:约 28 kW 持续功率,即每年约 245 MWh。
- 按商业电价综合费率 0.28 新元/kWh 计算,这相当于每年约 68 600 新元的可避免成本,且尚未计入 PUE 罚则。
- 同样的谐波负载会使一台 2 500 kVA 变压器降额约 12%,相当于损失 300 kVA 可用的 IT 增长余量。
这一切都不会作为单独一行出现在电费账单上,而是隐藏在千瓦时总数之中。PQMS 能将其明确显现出来,并让运营团队据以构建整改的商业论证:在此规模下,通常采用滤波器或有源谐波调节装置,投资回收期为 2–3 年。
5. 在何处布点:MSB、UPS、PDU 及下游
传感器的布点位置比数量更重要。一套最低限度的数据中心仪表配置应覆盖四个层级:
- 主配电柜(MSB)进线:与公用电网的法定公共连接点。配置 Class A 电能表;这是其数据将在任何纠纷或 BCA 提交中被引用的设备。
- UPS 输入和输出:输入侧电能表量化数据中心向上游呈现的谐波负担;输出侧电能表量化交付给 IT 的质量。二者之差即 UPS 所增添的价值。
- PDU 和母线槽分接:在机柜馈电处进行分支回路监测(BCM)。这正是被搁置的容量得以显现之处。
- 备用发电机和 ATS:以次周波分辨率捕获转换事件。大多数未被发现的 IT 中断都可追溯到此处的一次有缺陷的切换。
一条非正式的经验法则:每个电压转换环节(中压 → 低压 → UPS → PDU)配置一台 Class A 仪表,每条下游分支配置一台 Class S 或 Class B 设备。试图用单一仪表覆盖一切,要么在机柜处超额投入,要么在进线处仪表配置不足。
6. 将 PQMS 桥接至 DCIM 和 BMS 以实现统一可见性
一套仅运行在自家笔记本电脑上的 PQMS 对谁都没有帮助。现代仪表可同时提供 Modbus TCP、IEC 61850 GOOSE、MQTT 和 BACnet/IP,使同一数据集能够供给三类不同的使用方:
- DCIM用于容量规划和机柜级费用分摊,PQMS 贡献的是谐波降额之后的“真实”可用电流。
- BMS通过既有的 7×24 控制台进行告警升级,设施团队不应再需要一块新的显示屏。
- 可持续发展 / ESG 报告:电能质量数据可用于细化 Scope 2 报告,并支持 SS 564(新加坡能源管理标准)的提交。
这正是集成架构发挥价值之处。EcoXplore 的 DCIM 与能源监测解决方案经过精心设计,使 PQMS 数据与制冷、IT 负载和 BMS 遥测数据落入同一数据存储,无需屏幕抓取或一次性集成。
7. 新加坡合规:SS 638、BCA Green Mark 与 EMA 框架
有三套本地框架决定了一套数据中心 PQMS 必须产出哪些内容:
- SS 638:2018(新加坡电气安装实务守则)要求对任何具有显著非线性负载的安装进行谐波评估,每一座现代数据中心都符合此条件。
- 面向新建数据中心的 BCA Green Mark会因分项计量的精细度和对电气配电的实时监测而给予加分。关于分项计量层级,请参阅我们的配套文章BCA Green Mark 能源监测。
- EMA 供电质量守则(Quality of Supply Code)界定了公用事业方必须交付的电压和频率范围,进而也界定了数据中心在合同上可依赖的范围。位于 PCC 处的 Class A PQMS 是纠纷中唯一可接受的证据。
为受监管租户提供服务的运营商,包括 MAS TRM 下的银行、MOH 下的医疗机构、IM8 下的政府部门,均应在监测系统本身之上增加数据完整性控制。EcoXplore 的监测平台建立在通过 ISO 27001:2022 认证的信息安全管理体系之上,因此测量数据的监管链可实现端到端的可审计。
8. 设施经理的行动清单
- 确认你现有的电能表是否为 IEC 61000-4-30 Class A。若不是,它所产生的数据无法在公用事业纠纷中作为依据。
- 在 MSB 进线、UPS 输入、UPS 输出,以及至少一台具代表性的 PDU 处布设传感器。
- 将 10 分钟聚合配置为法律记录;同时保留 3 秒和波形捕获缓冲区以用于取证性事件。
- 依据 IEEE 519-2022 的电压和电流限值设定告警阈值,而非沿用厂商默认值。
- 将 PQMS 数据导入与 DCIM、BMS 和能源分项计量表相同的数据存储,数据孤岛会令一切努力付诸东流。
- 每季度审查谐波概况。随着 IT 密度增长,负载会发生变化;调试时设定的阈值会出现漂移。
联系我们的团队
EcoXplore 在新加坡及东南亚设计并部署 IEC 61000-4-30 Class A 电能质量监测,并与 DCIM、BMS 和能源管理平台集成。如果您正在规划新建项目、Green Mark 重新认证,或在一次险情之后进行整改,请联系我们的团队,大多数合作都从为期一天的现场踏勘和一份测点图开始。
การตรวจสอบคุณภาพไฟฟ้าของศูนย์ข้อมูล: ฮาร์มอนิก ขีดจำกัด THD และ IEC 61000-4-30 ในสถานประกอบการที่สิงคโปร์
สิงคโปร์เป็นที่ตั้งของศูนย์ข้อมูลที่เปิดดำเนินการมากกว่า 70 แห่ง และกำลังจะเพิ่มกำลังการผลิตที่ได้รับการรับรองอีก 300 MW ภายใต้โครงการ 2024 Data Centre - Call for Application ทุกเมกะวัตต์ที่เพิ่มเข้ามาตั้งอยู่หลังสวิตช์เกียร์ที่ถูกปนเปื้อนมากขึ้นเรื่อย ๆ จากกระแสฮาร์มอนิก รอยบากของแรงดันไฟฟ้า และเหตุการณ์ชั่วครู่ (transient) แต่ทีมงานสถานประกอบการส่วนใหญ่ยังคงพึ่งพามิเตอร์วัดพลังงานพื้นฐานที่ติดตั้งมากับแผงสวิตช์หลักเท่านั้น ซึ่งเพียงพอสำหรับการเรียกเก็บเงินตามหน่วยกิโลวัตต์-ชั่วโมง แต่ยังห่างไกลจากการปกป้องเวลาทำงานต่อเนื่อง (uptime) หรือการรักษาเป้าหมาย PUE
คู่มือฉบับนี้อธิบายว่าระบบตรวจสอบคุณภาพไฟฟ้า (PQMS) ที่ออกแบบมาเฉพาะสำหรับศูนย์ข้อมูลวัดอะไรบ้าง มาตรฐานใดที่เป็นหลักยึดของการวัดเหล่านั้น และควรติดตั้งเซ็นเซอร์ไว้ที่ใดเพื่อให้ข้อมูลที่ได้นำไปใช้ประโยชน์ได้จริง คู่มือนี้เขียนขึ้นสำหรับผู้จัดการสถานประกอบการหรือหัวหน้างานฝ่าย M&E ที่ต้องระบุข้อกำหนด ปรับปรุง หรือตรวจสอบ PQMS ก่อนการตรวจสอบจากการไฟฟ้าครั้งถัดไปหรือก่อนการยื่นต่อ BCA
1. เหตุใดศูนย์ข้อมูลจึงเสี่ยงต่อปัญหาคุณภาพไฟฟ้าเป็นพิเศษ
ระบบไฟฟ้าของศูนย์ข้อมูลเป็นโหลดไม่เชิงเส้น (non-linear load) ตามตำราอย่างแท้จริง โหลดหลักสองประเภท ได้แก่ วงจรเรียงกระแสของ UPS และแหล่งจ่ายไฟแบบสวิตชิงของอุปกรณ์ IT ดึงกระแสเป็นพัลส์แคบ ๆ ใกล้กับจุดยอดของรูปคลื่นแรงดันไฟฟ้า ผลลัพธ์คือรูปคลื่นกระแสที่อุดมไปด้วยฮาร์มอนิกอันดับคี่ (อันดับ 3, 5, 7, 11, 13)
- ความร้อนในหม้อแปลงและสายเคเบิล กระแสฮาร์มอนิกเพิ่มการสูญเสีย I²R โดยไม่ส่งกำลังจริงออกไป การเพิ่มขึ้นของความเพี้ยนฮาร์มอนิกรวมของกระแส (THD-I) เพียง 5% สามารถทำให้การสูญเสียในหม้อแปลงเพิ่มขึ้น 15–25%
- การโอเวอร์โหลดของสายนิวทรัล ฮาร์มอนิกอันดับสาม (triplen) (อันดับ 3, 9, 15) ไม่หักล้างกันในสายนิวทรัล แต่กลับรวมกัน ไรเซอร์ของศูนย์ข้อมูลหลายแห่งใช้สายนิวทรัลที่มีขนาดเล็กเกินไปซึ่งมาจากยุคก่อนที่โหลด SMPS ความถี่สูงจะครองตลาด
- การสูญเสียความสามารถในการรองรับโหลด พิกัดบนเนมเพลตของสวิตช์เกียร์ตั้งอยู่บนสมมติฐานของกระแสรูปไซน์ แผงสวิตช์ที่มีพิกัด 2 000 A อาจจ่ายความสามารถ IT ที่ใช้งานได้จริงเพียง 1 700 A เมื่อใช้การลดพิกัด (derating) จากฮาร์มอนิกแล้ว
- เบรกเกอร์ทริปโดยไม่จำเป็น รอยบากของแรงดันไฟฟ้าและทรานเซียนต์ในระดับต่ำกว่าหนึ่งรอบคลื่นกระตุ้นอุปกรณ์ป้องกันกระแสรั่วลงดินและอาร์กฟอลต์ ซึ่งโดยปกติจะไม่ทำงานภายใต้โหลดเชิงเส้น
ไม่มีรูปแบบความล้มเหลวใดในเหล่านี้ที่มองเห็นได้จากมิเตอร์กิโลวัตต์-ชั่วโมง สิ่งเหล่านี้จะปรากฏก็ต่อเมื่อมีการสุ่มตัวอย่างกระแสและแรงดันไฟฟ้าเร็วพอที่จะแยกแยะองค์ประกอบฮาร์มอนิกได้ ซึ่งโดยทั่วไปอยู่ที่ 128 ตัวอย่างต่อรอบคลื่นหรือสูงกว่า และรวมข้อมูลตามมาตรฐานที่ได้รับการยอมรับ
2. สิ่งที่เรียกว่า "ดี" หน้าตาเป็นอย่างไร: THD, IEEE 519 และ IEC 61000-4-30 Class A
มีสองมาตรฐานที่กำหนดกติกาของเรื่องนี้
IEC 61000-4-30:2015 (Class A) ระบุว่าเครื่องมือวัดคุณภาพไฟฟ้าต้องวัดอย่างไร ทั้งด้านความแม่นยำ การรวมข้อมูลตามช่วงเวลา (3 วินาที, 10 นาที, 2 ชั่วโมง) และพฤติกรรมการตั้งค่าสถานะ (flagging) ในระหว่างเกิดการรบกวน เครื่องมือ Class A จากผู้ผลิตรายหนึ่งจะต้องให้ผลลัพธ์ที่เหมือนกันทางสถิติกับเครื่องมือ Class A จากผู้ผลิตอีกรายหนึ่งเมื่อวัดรูปคลื่นเดียวกัน อะไรก็ตามที่ต่ำกว่า Class A (Class S หรือ Class B) ยอมรับได้สำหรับการดูแนวโน้ม แต่ไม่ควรใช้สำหรับการรายงานความสอดคล้องตามข้อกำหนดหรือเป็นหลักฐานตามสัญญา
IEEE 519-2022 กำหนดว่าตัวเลขเหล่านั้นควรเป็นเท่าใด ณ จุดเชื่อมต่อร่วม (PCC) กับการไฟฟ้า:
| พารามิเตอร์ | ขีดจำกัด (ทั่วไปสำหรับศูนย์ข้อมูลแรงดันต่ำ) | เหตุใดจึงสำคัญ |
|---|---|---|
| ความเพี้ยนฮาร์มอนิกของแรงดันไฟฟ้า (THD-V) | ≤ 5% | เกิน 5% จะทำให้อุปกรณ์อิเล็กทรอนิกส์ที่ไวต่อสัญญาณเสื่อมสภาพและทำให้ UPS ทริปเข้าโหมดบายพาส |
| ฮาร์มอนิกแรงดันไฟฟ้ารายอันดับ | ≤ 3% | เสี่ยงต่อการเกิดเรโซแนนซ์ที่อันดับ 5 และ 7 |
| TDD ของกระแสที่ PCC | ≤ 8% (ขึ้นอยู่กับอัตราส่วน Isc/IL) | การไฟฟ้าอาจกำหนดบทลงโทษหรือปฏิเสธการเชื่อมต่อใหม่ |
| ความไม่สมดุลของแรงดันไฟฟ้า | ≤ 2% | เกิน 2% จะเร่งความเสียหายของแหล่งจ่ายไฟ IT สามเฟส |
| การเบี่ยงเบนของความถี่ | ± 1% ของ 50 Hz | เกินกว่านี้ UPS จะปฏิเสธไฟจากเมนและทำงานจากแบตเตอรี่ |
หาก PQMS ไม่ตั้งค่าสถานะการละเมิดเกณฑ์เหล่านี้โดยอัตโนมัติ ก็ถือว่าไม่ได้ทำหน้าที่ของมัน ระบบตรวจสอบคุณภาพไฟฟ้า (PQMS) ที่ยึดตามมาตรฐานควรสร้างรายงานตามมาตรฐาน IEC 61000-4-30 Class A ได้โดยไม่ต้องส่งออกข้อมูลและประมวลผลภายหลังด้วยมือ
3. พารามิเตอร์เจ็ดประการที่ PQMS ของศูนย์ข้อมูลต้องบันทึก
- แรงดันไฟฟ้าและกระแส RMS รายเฟส รวมข้อมูลที่ช่วง 3 วินาที, 10 นาที และ 2 ชั่วโมง การรวมข้อมูลที่ 10 นาทีเป็นหลักฐานทางกฎหมายสำหรับข้อพิพาทกับการไฟฟ้า
- THD ของแรงดันไฟฟ้าและกระแส พร้อมสเปกตรัมฮาร์มอนิกรายอันดับสูงถึงอันดับที่ 50 จำกัดตัวเองไว้ที่อันดับที่ 25 เฉพาะในกรณีที่ PQMS ไม่สามารถจัดเก็บได้มากกว่านั้น แต่คุณจะพลาดฮาร์มอนิกความถี่สวิตชิงจากชิลเลอร์ที่ขับเคลื่อนด้วย VFD
- ความไม่สมดุลของแรงดันไฟฟ้าและกระแส โดยใช้วิธีองค์ประกอบสมมาตร (อัตราส่วนลำดับลบที่แท้จริง) ไม่ใช่การประมาณค่าแบบง่ายด้วยค่าสูงสุดลบด้วยค่าเฉลี่ย
- การกะพริบ (Pst และ Plt) ตามมาตรฐาน IEC 61000-4-15 สำคัญน้อยกว่าสำหรับโหลด IT แต่จำเป็นอย่างยิ่งเมื่อศูนย์ข้อมูลใช้สายป้อนแรงดันปานกลางร่วมกับผู้เช่าที่เป็นโรงงานผลิต
- การเปลี่ยนแปลงแรงดันไฟฟ้าอย่างรวดเร็ว แรงดันตก และแรงดันเกิน พร้อมการตรวจจับแบบรอบต่อรอบ เส้นโค้ง ITIC และ SEMI F47 ควรถูกซ้อนทับบนบันทึกเหตุการณ์โดยอัตโนมัติ
- ทรานเซียนต์และอิมพัลส์ ลงไปถึงความละเอียดระดับต่ำกว่าไมโครวินาที ณ จุดสำคัญ (อินพุตของ UPS, สวิตช์ถ่ายโอน) นี่คือสิ่งที่แยก PQMS ออกจากมิเตอร์วัดกำลังไฟฟ้าพื้นฐาน
- กำลังจริง กำลังรีแอกทีฟ และกำลังปรากฏรายเฟส โดยรายงานตัวประกอบกำลังที่แท้จริงและตัวประกอบกำลังจากการเลื่อนเฟส (displacement power factor) แยกจากกัน การสับสนระหว่างสองค่านี้เป็นสาเหตุที่พบบ่อยที่สุดของการกำหนดขนาดชุดคาปาซิเตอร์ผิดพลาด
สำหรับการเปรียบเทียบขอบเขตการตรวจสอบที่ลึกซึ้งยิ่งขึ้น โปรดดูการวิเคราะห์ของเราเรื่อง EMS เทียบกับ PQMS โดยการจัดการพลังงานมุ่งเน้นไปที่การบริโภค ส่วน PQMS มุ่งเน้นไปที่คุณภาพและความน่าเชื่อถือ
4. ฮาร์มอนิกค่อย ๆ บั่นทอน PUE และความสามารถในการรองรับ IT อย่างเงียบ ๆ ได้อย่างไร
ตัวอย่างการคำนวณ: ศูนย์ข้อมูลที่มีโหลด IT ขนาด 2 MW ทำงานที่ THD-I 8% ทั่วทั้งอินพุตของ UPS
- การสูญเสียในหม้อแปลงเพิ่มขึ้นประมาณ 18% เมื่อเทียบกับกรณีรูปไซน์ ซึ่งคิดเป็นความร้อนเหลือทิ้งเพิ่มเติมราว 22 kW
- ความร้อนดังกล่าวต้องถูกระบายออกโดยระบบ CRAC/CRAH ที่ประสิทธิภาพเชิงกลทั่วไปที่ 3.5 COP บทลงโทษด้านการทำความเย็นคืออินพุตไฟฟ้าเพิ่มอีก 6.3 kW
- โหลดรวมที่สามารถป้องกันได้: ~28 kW อย่างต่อเนื่อง หรือประมาณ 245 MWh ต่อปี
- ที่อัตราค่าไฟเชิงพาณิชย์แบบผสมที่ S$0.28/kWh นั่นคือต้นทุนที่หลีกเลี่ยงได้ราว S$68 600 ต่อปี ก่อนที่จะรวมบทลงโทษด้าน PUE
- โหลดฮาร์มอนิกเดียวกันนี้ลดพิกัดของหม้อแปลงขนาด 2 500 kVA ลงประมาณ 12% เทียบเท่ากับการสูญเสียพื้นที่รองรับการเติบโตของ IT ที่ใช้งานได้จริง 300 kVA
ไม่มีสิ่งใดในเหล่านี้ปรากฏเป็นรายการแยกต่างหากในใบเรียกเก็บค่าไฟ ทั้งหมดซ่อนตัวอยู่ในยอดรวมกิโลวัตต์-ชั่วโมง PQMS เปิดเผยสิ่งนี้ออกมาอย่างชัดเจน และช่วยให้ทีมปฏิบัติการสร้างกรณีทางธุรกิจสำหรับการแก้ไข ซึ่งโดยทั่วไปคือฟิลเตอร์หรืออุปกรณ์ปรับสภาพฮาร์มอนิกแบบแอกทีฟที่มีระยะเวลาคืนทุน 2–3 ปีในขนาดนี้
5. ควรติดตั้งเครื่องมือวัดที่ใด: MSB, UPS, PDU และส่วนปลายทาง
ตำแหน่งของเซ็นเซอร์สำคัญกว่าจำนวนเซ็นเซอร์ ชุดเครื่องมือวัดขั้นต่ำสำหรับศูนย์ข้อมูลครอบคลุมสี่ชั้น:
- จุดรับไฟเข้าของแผงสวิตช์หลัก (MSB) คือจุดเชื่อมต่อร่วมตามกฎหมายกับการไฟฟ้า ใช้มิเตอร์ Class A นี่คืออุปกรณ์ที่ข้อมูลจะถูกอ้างอิงในข้อพิพาทใด ๆ หรือในการยื่นต่อ BCA
- อินพุตและเอาต์พุตของ UPS มิเตอร์ที่อินพุตวัดปริมาณภาระฮาร์มอนิกที่ศูนย์ข้อมูลสร้างขึ้นต่อระบบต้นทาง ส่วนมิเตอร์ที่เอาต์พุตวัดคุณภาพที่ส่งมอบให้กับ IT ผลต่างคือคุณค่าที่ UPS เพิ่มเข้ามา
- PDU และจุดต่อแยกของบัสเวย์ การตรวจสอบวงจรย่อย (BCM) ที่จุดป้อนของแร็ก นี่คือจุดที่ความสามารถที่ถูกกักไว้ (stranded capacity) จะมองเห็นได้
- เครื่องกำเนิดไฟฟ้าสำรองและ ATS เก็บข้อมูลเหตุการณ์การถ่ายโอนด้วยความละเอียดระดับต่ำกว่าหนึ่งรอบคลื่น เหตุการณ์ไฟดับของ IT ที่ยังไม่ถูกค้นพบส่วนใหญ่สืบย้อนกลับไปได้ถึงการถ่ายโอนที่บกพร่อง ณ จุดนี้
หลักการคร่าว ๆ อย่างไม่เป็นทางการ: เครื่องมือ Class A หนึ่งตัวต่อการเปลี่ยนระดับแรงดันไฟฟ้าหนึ่งจุด (MV → LV → UPS → PDU) และอุปกรณ์ Class S หรือ Class B หนึ่งตัวต่อวงจรย่อยปลายทางหนึ่งวงจร การพยายามใช้เครื่องมือเพียงตัวเดียวให้ครอบคลุมทุกอย่างจะนำไปสู่การใช้จ่ายเกินความจำเป็นที่แร็ก หรือมีเครื่องมือวัดไม่เพียงพอที่จุดรับไฟเข้า
6. การเชื่อม PQMS เข้ากับ DCIM และ BMS เพื่อการมองเห็นแบบรวมศูนย์
PQMS ที่อยู่บนแล็ปท็อปของตัวเองตามลำพังไม่ช่วยอะไรใครเลย เครื่องมือสมัยใหม่รองรับ Modbus TCP, IEC 61850 GOOSE, MQTT และ BACnet/IP ได้พร้อมกัน ทำให้ชุดข้อมูลเดียวกันป้อนให้กับผู้ใช้สามฝ่ายที่แตกต่างกัน:
- DCIM สำหรับการวางแผนความสามารถและการเรียกเก็บค่าใช้จ่ายในระดับแร็ก โดย PQMS มีส่วนสนับสนุนค่ากระแสที่ใช้งานได้ "จริง" หลังจากการลดพิกัดจากฮาร์มอนิกแล้ว
- BMS สำหรับการยกระดับการแจ้งเตือนผ่านคอนโซลที่ทำงานตลอด 24/7 ที่มีอยู่เดิม ทีมงานสถานประกอบการไม่ควรต้องใช้หน้าจอใหม่อีกชุด
- การรายงานด้านความยั่งยืน / ESG ข้อมูลคุณภาพไฟฟ้าช่วยปรับปรุงการรายงาน Scope 2 ให้ละเอียดขึ้น และสนับสนุนการยื่นตาม SS 564 (มาตรฐานสิงคโปร์สำหรับการจัดการพลังงาน)
นี่คือจุดที่สถาปัตยกรรมการบูรณาการแสดงคุณค่าของมันออกมา โซลูชัน DCIM และการตรวจสอบพลังงาน ของ EcoXplore ออกแบบมาให้ข้อมูล PQMS ลงไปอยู่ในแหล่งจัดเก็บเดียวกันกับข้อมูลการทำความเย็น โหลด IT และข้อมูลทางไกลของ BMS โดยไม่ต้องดึงข้อมูลจากหน้าจอ (screen-scraping) หรือทำการบูรณาการเฉพาะกิจ
7. ความสอดคล้องตามข้อกำหนดของสิงคโปร์: SS 638, BCA Green Mark และกรอบของ EMA
กรอบในท้องถิ่นสามกรอบกำหนดสิ่งที่ PQMS ของศูนย์ข้อมูลต้องสร้างขึ้น:
- SS 638:2018 (ประมวลหลักปฏิบัติของสิงคโปร์สำหรับการติดตั้งระบบไฟฟ้า) กำหนดให้ต้องมีการประเมินฮาร์มอนิกสำหรับการติดตั้งใด ๆ ที่มีโหลดไม่เชิงเส้นในปริมาณมาก ซึ่งศูนย์ข้อมูลสมัยใหม่ทุกแห่งเข้าข่าย
- BCA Green Mark สำหรับศูนย์ข้อมูลใหม่ ให้คะแนนสำหรับความละเอียดของการวัดแบบย่อย (sub-metering) และการตรวจสอบการกระจายไฟฟ้าแบบเรียลไทม์ โปรดดูบทความประกอบของเราเรื่อง การตรวจสอบพลังงานตาม BCA Green Mark สำหรับลำดับชั้นของการวัดแบบย่อย
- EMA Quality of Supply Code กำหนดขอบเขตของแรงดันไฟฟ้าและความถี่ที่การไฟฟ้าต้องส่งมอบ และโดยปริยายก็คือขอบเขตที่ศูนย์ข้อมูลสามารถพึ่งพาได้ตามสัญญา PQMS ระดับ Class A ที่ PCC เป็นหลักฐานเดียวที่ยอมรับได้ในข้อพิพาท
ผู้ดำเนินการที่ให้บริการผู้เช่าที่อยู่ภายใต้การกำกับดูแล ได้แก่ ธนาคารภายใต้ MAS TRM, สถานพยาบาลภายใต้ MOH, และหน่วยงานราชการภายใต้ IM8 ควรเพิ่มมาตรการควบคุมความถูกต้องของข้อมูล (data integrity) บนตัวระบบตรวจสอบเอง แพลตฟอร์มการตรวจสอบของ EcoXplore สร้างขึ้นบนระบบบริหารจัดการความมั่นคงปลอดภัยสารสนเทศที่ได้รับการรับรองมาตรฐาน ISO 27001:2022 ดังนั้นห่วงโซ่การควบคุม (chain-of-custody) ของข้อมูลการวัดจึงสามารถตรวจสอบย้อนกลับได้แบบครบวงจร
8. รายการตรวจสอบสำหรับผู้จัดการสถานประกอบการ
- ยืนยันว่ามิเตอร์ที่มีอยู่ของคุณเป็นไปตามมาตรฐาน IEC 61000-4-30 Class A หรือไม่ หากไม่เป็น ข้อมูลที่ได้จะไม่สามารถใช้สู้ในข้อพิพาทกับการไฟฟ้าได้
- ติดตั้งเซ็นเซอร์ที่จุดรับไฟเข้าของ MSB, อินพุตของ UPS, เอาต์พุตของ UPS และที่ PDU ตัวแทนอย่างน้อยหนึ่งตัว
- ตั้งค่าการรวมข้อมูลที่ 10 นาทีให้เป็นบันทึกตามกฎหมาย และคงบัฟเฟอร์การจับข้อมูลที่ 3 วินาทีและการจับรูปคลื่นไว้สำหรับเหตุการณ์ที่ต้องตรวจสอบทางนิติวิทยาศาสตร์
- ตั้งเกณฑ์การแจ้งเตือนตามขีดจำกัดแรงดันไฟฟ้าและกระแสของ IEEE 519-2022 ไม่ใช่ค่าเริ่มต้นจากผู้ผลิต
- ส่งข้อมูล PQMS เข้าไปยังแหล่งจัดเก็บเดียวกันกับ DCIM, BMS และมิเตอร์วัดพลังงานแบบย่อย เพราะการแยกข้อมูลออกเป็นส่วน ๆ (silo) ทำให้เสียวัตถุประสงค์ไป
- ทบทวนโปรไฟล์ฮาร์มอนิกทุกไตรมาส โหลดเปลี่ยนแปลงไปเมื่อความหนาแน่นของ IT เพิ่มขึ้น เกณฑ์ที่ตั้งไว้ตอนเริ่มเดินระบบจะคลาดเคลื่อนไปตามเวลา
พูดคุยกับทีมงาน
EcoXplore ออกแบบและติดตั้งระบบตรวจสอบคุณภาพไฟฟ้าระดับ IEC 61000-4-30 Class A ทั่วทั้งสิงคโปร์และเอเชียตะวันออกเฉียงใต้ โดยบูรณาการเข้ากับแพลตฟอร์ม DCIM, BMS และการจัดการพลังงาน หากคุณกำลังวางแผนสร้างใหม่ การรับรอง Green Mark ใหม่ หรือการแก้ไขหลังเหตุการณ์เฉียดฉิว พูดคุยกับทีมงานของเรา ได้เลย โดยส่วนใหญ่งานจะเริ่มต้นด้วยการเดินสำรวจหนึ่งวันและการจัดทำแผนผังจุดวัด
Pemantauan Kualitas Daya Pusat Data: Harmonisa, Batas THD dan IEC 61000-4-30 di Fasilitas Singapura
Singapura memiliki lebih dari 70 pusat data operasional dan sedang dalam jalur untuk menambah 300 MW kapasitas bersertifikat lainnya di bawah 2024 Data Centre - Call for Application. Setiap megawatt tambahan berada di belakang switchgear yang semakin tercemar oleh arus harmonisa, takikan tegangan dan peristiwa transien. Namun sebagian besar tim fasilitas masih mengandalkan meter energi dasar yang terpasang di papan hubung utama mereka. Itu cukup untuk menagih kilowatt-jam; itu jauh dari cukup untuk melindungi uptime atau mempertahankan target PUE.
Panduan ini menjelaskan apa yang diukur oleh sistem pemantauan kualitas daya pusat data (PQMS) yang dirancang khusus, standar mana yang menjadi acuan pengukuran tersebut, dan di mana harus memasang sensor agar datanya benar-benar berguna. Panduan ini ditulis untuk manajer fasilitas atau pemimpin M&E yang perlu menentukan spesifikasi, melakukan retrofit atau mengaudit PQMS sebelum audit utilitas atau pengajuan BCA berikutnya.
1. Mengapa pusat data secara unik terpapar pada masalah kualitas daya
Sistem kelistrikan pusat data adalah contoh klasik beban non-linier. Dua beban dominan - penyearah UPS dan catu daya mode sakelar IT - menarik arus dalam pulsa sempit di dekat puncak gelombang tegangan. Hasilnya adalah gelombang arus yang kaya akan harmonisa ganjil (ke-3, ke-5, ke-7, ke-11, ke-13).
- Panas pada transformator dan kabel. Arus harmonisa menambah rugi-rugi I²R tanpa memberikan daya nyata. Peningkatan 5% pada distorsi harmonisa total arus (THD-I) dapat menaikkan rugi-rugi transformator sebesar 15–25%.
- Kelebihan beban netral. Harmonisa triplen (ke-3, ke-9, ke-15) tidak saling meniadakan pada konduktor netral; mereka menjumlah. Banyak riser pusat data menggunakan netral yang berukuran terlalu kecil yang berasal dari era sebelum beban SMPS frekuensi tinggi mendominasi.
- Kehilangan kapasitas. Peringkat nameplate switchgear mengasumsikan arus sinusoidal. Sebuah papan hubung dengan peringkat 2 000 A mungkin hanya memberikan 1 700 A kapasitas IT yang dapat digunakan setelah derating harmonisa diterapkan.
- Pemutusan pemutus sirkuit yang mengganggu. Takikan tegangan dan transien sub-siklus memicu perangkat gangguan-tanah dan gangguan-busur yang sebaliknya diam di bawah beban linier.
Tidak satu pun dari mode kegagalan ini terlihat pada meter kilowatt-jam. Mereka hanya muncul ketika arus dan tegangan diambil sampelnya cukup cepat untuk menyelesaikan konten harmonisa - biasanya pada 128 sampel per siklus atau lebih tinggi - dan diagregasi sesuai dengan standar yang diakui.
2. Seperti apa "yang baik" itu: THD, IEEE 519 dan IEC 61000-4-30 Class A
Dua standar mendefinisikan aturan mainnya.
IEC 61000-4-30:2015 (Class A) menentukan bagaimana instrumen kualitas daya harus mengukur: akurasinya, agregasi waktu (3 s, 10 menit, 2 jam), dan perilaku penandaan selama gangguan. Instrumen Class A dari satu vendor harus menghasilkan hasil yang identik secara statistik dengan instrumen Class A dari vendor lain pada gelombang yang sama. Apa pun di bawah Class A (Class S atau Class B) dapat diterima untuk pemantauan tren tetapi tidak boleh digunakan untuk pelaporan kepatuhan atau bukti kontraktual.
IEEE 519-2022 mendefinisikan berapa angka tersebut seharusnya. Pada titik sambungan bersama (PCC) dengan utilitas:
| Parameter | Batas (pusat data LV tipikal) | Mengapa itu penting |
|---|---|---|
| THD tegangan (THD-V) | ≤ 5% | Di atas 5% menurunkan kinerja elektronik sensitif dan memicu bypass UPS |
| Harmonisa tegangan individual | ≤ 3% | Risiko resonansi pada ke-5 dan ke-7 |
| TDD arus pada PCC | ≤ 8% (tergantung rasio Isc/IL) | Utilitas dapat mengenakan penalti atau menolak sambungan baru |
| Ketidakseimbangan tegangan | ≤ 2% | Di atas 2% mempercepat kegagalan PSU IT tiga fasa |
| Deviasi frekuensi | ± 1% dari 50 Hz | Di luar ini, UPS menolak jala-jala dan beroperasi dari baterai |
Jika PQMS tidak menandai pelanggaran ambang batas ini secara otomatis, maka ia tidak menjalankan tugasnya. Sistem Pemantauan Kualitas Daya (PQMS) yang berbasis standar harus menghasilkan laporan IEC 61000-4-30 Class A tanpa ekspor manual dan pemrosesan pasca.
3. Tujuh parameter yang harus dicatat oleh PQMS pusat data
- Tegangan dan arus RMS per fasa diagregasi pada 3 s, 10 menit dan 2 jam. Agregasi 10 menit adalah bukti hukum untuk sengketa utilitas.
- THD tegangan dan arus dengan spektrum harmonisa individual hingga orde ke-50. Batasi diri Anda hanya pada orde ke-25 jika PQMS tidak dapat menyimpan lebih banyak, tetapi Anda akan melewatkan harmonisa frekuensi pensaklaran dari chiller yang digerakkan VFD.
- Ketidakseimbangan tegangan dan arus menggunakan metode komponen simetris (rasio urutan-negatif sejati), bukan aproksimasi sederhana maksimum-dikurangi-rata-rata.
- Kedipan (Pst dan Plt) per IEC 61000-4-15. Kurang kritis untuk beban IT tetapi penting ketika pusat data berbagi pengumpan MV dengan penyewa manufaktur.
- Perubahan tegangan cepat, sag dan swell dengan deteksi siklus-demi-siklus. Kurva ITIC dan SEMI F47 harus secara otomatis dihamparkan pada log peristiwa.
- Transien dan impuls hingga resolusi sub-mikrodetik pada titik kritis (input UPS, sakelar transfer). Inilah yang membedakan PQMS dari meter daya dasar.
- Daya aktif, reaktif dan semu per fasa dengan faktor daya sejati dan faktor daya pergeseran yang dilaporkan secara terpisah. Membingungkan keduanya adalah penyebab paling umum dari kesalahan ukuran bank kapasitor.
Untuk perbandingan yang lebih mendalam tentang cakupan pemantauan, lihat uraian kami tentang EMS vs PQMS - manajemen energi berfokus pada konsumsi, PQMS berfokus pada kualitas dan keandalan.
4. Bagaimana harmonisa secara diam-diam mengikis PUE dan kapasitas IT
Sebuah contoh terperinci: pusat data dengan beban IT 2 MW yang beroperasi pada 8% THD-I di seluruh input UPS-nya.
- Rugi-rugi transformator naik sekitar 18% dibandingkan kasus sinusoidal, kira-kira 22 kW panas limbah tambahan.
- Panas itu harus dibuang oleh perangkat CRAC/CRAH. Pada efisiensi mekanis tipikal 3.5 COP, penalti pendinginan adalah tambahan 6.3 kW input listrik.
- Total beban yang dapat dicegah: ~28 kW kontinu, atau sekitar 245 MWh per tahun.
- Pada tarif gabungan komersial S$0.28/kWh, itu kira-kira S$68 600 per tahun dalam biaya yang dapat dihindari, sebelum penalti PUE.
- Beban harmonisa yang sama menderate transformator 2 500 kVA sekitar 12%, setara dengan kehilangan 300 kVA headroom pertumbuhan IT yang dapat digunakan.
Tidak satu pun dari ini muncul pada tagihan energi sebagai baris terpisah. Itu tersembunyi di dalam total kilowatt-jam. PQMS menampilkannya secara eksplisit dan memungkinkan tim operasi membangun kasus bisnis remediasi: biasanya filter atau pengondisi harmonisa aktif dengan pengembalian modal 2–3 tahun pada skala ini.
5. Di mana harus memasang instrumen: MSB, UPS, PDU dan hilir
Penempatan sensor lebih penting daripada jumlah sensor. Set instrumentasi pusat data minimum mencakup empat lapisan:
- Incomer papan hubung utama (MSB) - titik sambungan bersama yang sah dengan utilitas. Meter Class A; ini adalah perangkat yang datanya akan dikutip dalam sengketa atau pengajuan BCA apa pun.
- Input dan output UPS - meter input mengkuantifikasi beban harmonisa yang ditampilkan pusat data ke hulu; meter output mengkuantifikasi kualitas yang dikirim ke IT. Selisihnya adalah nilai yang ditambahkan UPS.
- Tap-off PDU dan busway - pemantauan sirkuit cabang (BCM) pada pengumpan rak. Di sinilah kapasitas yang terdampar menjadi terlihat.
- Generator siaga dan ATS - tangkap peristiwa transfer dengan resolusi sub-siklus. Sebagian besar pemadaman IT yang tidak ditemukan dapat dilacak kembali ke transfer yang cacat di sini.
Aturan praktis informal: satu instrumen Class A per transisi tegangan (MV → LV → UPS → PDU) dan satu perangkat Class S atau Class B per cabang hilir. Mencoba membuat satu instrumen mencakup segalanya akan terlalu boros di rak atau kurang berinstrumen di incomer.
6. Menjembatani PQMS ke DCIM dan BMS untuk visibilitas terpadu
PQMS yang berdiri sendiri di laptopnya sendiri tidak membantu siapa pun. Instrumen modern mengekspos Modbus TCP, IEC 61850 GOOSE, MQTT dan BACnet/IP secara bersamaan, memungkinkan dataset yang sama memberi makan tiga konsumen yang berbeda:
- DCIM untuk perencanaan kapasitas dan pembebanan biaya tingkat rak - PQMS menyumbangkan arus "nyata" yang dapat digunakan setelah derating harmonisa.
- BMS untuk eskalasi alarm melalui konsol 24/7 yang ada - tim fasilitas tidak perlu jendela kaca baru.
- Pelaporan keberlanjutan / ESG - data kualitas daya memberi makan penyempurnaan pelaporan Scope 2 dan mendukung pengajuan SS 564 (Standar Singapura untuk manajemen energi).
Di sinilah arsitektur integrasi membuktikan nilainya. Solusi DCIM dan pemantauan energi milik EcoXplore dirancang agar data PQMS mendarat di penyimpanan yang sama dengan telemetri pendinginan, beban IT dan BMS, tanpa screen-scraping atau integrasi sekali pakai.
7. Kepatuhan Singapura: SS 638, BCA Green Mark dan kerangka kerja EMA
Tiga kerangka kerja lokal membentuk apa yang harus dihasilkan PQMS pusat data:
- SS 638:2018 (Singapore Code of Practice untuk instalasi listrik) mensyaratkan penilaian harmonisa untuk setiap instalasi dengan beban non-linier yang signifikan - setiap pusat data modern memenuhi syarat.
- BCA Green Mark for New Data Centres memberikan poin untuk granularitas sub-metering dan pemantauan real-time retikulasi listrik. Lihat artikel pendamping kami tentang pemantauan energi BCA Green Mark untuk hierarki submetering.
- EMA Quality of Supply Code mendefinisikan amplop tegangan dan frekuensi yang harus dikirim utilitas, dan dengan demikian, amplop yang dapat diandalkan pusat data secara kontraktual. PQMS Class A pada PCC adalah satu-satunya bukti yang dapat diterima dalam sengketa.
Operator yang melayani penyewa teregulasi - bank di bawah MAS TRM, layanan kesehatan di bawah MOH, pemerintah di bawah IM8 - harus menambahkan kontrol integritas data pada sistem pemantauan itu sendiri. Platform pemantauan EcoXplore dibangun di atas Information Security Management System bersertifikat ISO 27001:2022, sehingga rantai-penjagaan data pengukuran dapat diaudit dari ujung ke ujung.
8. Daftar periksa tindakan untuk manajer fasilitas
- Konfirmasikan apakah meter Anda yang ada adalah IEC 61000-4-30 Class A. Jika tidak, data yang dihasilkannya tidak dapat mempertahankan sengketa utilitas.
- Tempatkan sensor di incomer MSB, input UPS, output UPS dan setidaknya satu PDU yang representatif.
- Konfigurasikan agregasi 10 menit sebagai catatan hukum; pertahankan buffer 3 detik dan penangkapan gelombang untuk peristiwa forensik.
- Atur ambang batas alarm terhadap batas tegangan dan arus IEEE 519-2022, bukan default vendor.
- Salurkan data PQMS ke penyimpanan yang sama dengan DCIM, BMS dan submeter energi - silo menggagalkan tujuannya.
- Tinjau profil harmonisa setiap kuartal. Beban berubah seiring kepadatan IT bertumbuh; ambang batas yang ditetapkan saat commissioning akan bergeser.
Bicara dengan tim kami
EcoXplore merancang dan menerapkan pemantauan kualitas daya IEC 61000-4-30 Class A di seluruh Singapura dan Asia Tenggara, terintegrasi dengan platform DCIM, BMS dan manajemen energi. Jika Anda merencanakan pembangunan baru, resertifikasi Green Mark, atau remediasi setelah nyaris terjadi insiden, bicaralah dengan tim kami - sebagian besar keterlibatan dimulai dengan penelusuran satu hari dan peta titik pengukuran.
Giám sát Chất lượng Điện năng cho Trung tâm Dữ liệu: Sóng hài, Giới hạn THD và IEC 61000-4-30 tại các Cơ sở ở Singapore
Singapore là nơi đặt hơn 70 trung tâm dữ liệu đang vận hành và đang trên đà bổ sung thêm 300 MW công suất được chứng nhận theo chương trình Data Centre - Call for Application năm 2024. Mỗi megawatt tăng thêm đều nằm sau hệ thống đóng cắt vốn ngày càng bị ô nhiễm bởi dòng điện sóng hài, xung lõm điện áp và các sự kiện quá độ. Tuy vậy, hầu hết các đội ngũ vận hành cơ sở vẫn dựa vào đồng hồ năng lượng cơ bản tích hợp trong tủ điện chính của họ. Đồng hồ đó đủ để tính tiền theo kilowatt giờ; nhưng còn lâu mới đủ để bảo vệ thời gian hoạt động liên tục hay bảo vệ một mục tiêu PUE.
Hướng dẫn này giải thích một hệ thống giám sát chất lượng điện năng (PQMS) chuyên dụng cho trung tâm dữ liệu đo những gì, những tiêu chuẩn nào làm nền tảng cho các phép đo đó, và lắp đặt cảm biến ở đâu để dữ liệu thực sự hữu ích. Tài liệu này được viết cho người quản lý cơ sở hoặc trưởng nhóm M&E, những người cần phải đặc tả, cải tạo hoặc kiểm toán một hệ thống PQMS trước kỳ kiểm toán điện lực hoặc kỳ nộp hồ sơ BCA tiếp theo.
1. Vì sao các trung tâm dữ liệu đặc biệt dễ bị ảnh hưởng bởi các vấn đề chất lượng điện năng
Hệ thống điện của một trung tâm dữ liệu là một tải phi tuyến kinh điển. Hai loại tải chiếm ưu thế - bộ chỉnh lưu của UPS và nguồn xung (SMPS) của thiết bị CNTT - rút dòng điện theo các xung hẹp gần đỉnh của dạng sóng điện áp. Kết quả là một dạng sóng dòng điện giàu sóng hài bậc lẻ (bậc 3, 5, 7, 11, 13).
- Nhiệt sinh ra trong máy biến áp và cáp. Dòng điện sóng hài làm tăng tổn hao I²R mà không truyền tải công suất thực. Mức tăng 5% trong tổng méo hài dòng điện (THD-I) có thể nâng tổn hao máy biến áp lên 15–25%.
- Quá tải dây trung tính. Các sóng hài bội ba (bậc 3, 9, 15) không triệt tiêu lẫn nhau trong dây trung tính; chúng cộng dồn. Nhiều đường dây đứng của trung tâm dữ liệu chạy với dây trung tính thiếu tiết diện, có từ thời kỳ trước khi các tải SMPS tần số cao chiếm ưu thế.
- Mất công suất. Thông số định mức ghi trên nhãn của thiết bị đóng cắt giả định dòng điện hình sin. Một tủ điện định mức 2 000 A có thể chỉ cung cấp được 1 700 A công suất CNTT khả dụng một khi áp dụng việc giảm định mức do sóng hài.
- Nhảy cầu dao gây phiền nhiễu. Xung lõm điện áp và các quá độ dưới một chu kỳ kích hoạt các thiết bị bảo vệ chạm đất và hồ quang vốn yên lặng dưới tải tuyến tính.
Không một chế độ hỏng hóc nào trong số này hiện rõ trên đồng hồ đo kilowatt giờ. Chúng chỉ xuất hiện khi dòng điện và điện áp được lấy mẫu đủ nhanh để phân giải nội dung sóng hài - thường là ở 128 mẫu mỗi chu kỳ hoặc cao hơn - và được tổng hợp theo một tiêu chuẩn được công nhận.
2. Thế nào là "tốt": THD, IEEE 519 và IEC 61000-4-30 Class A
Hai tiêu chuẩn xác định luật chơi.
IEC 61000-4-30:2015 (Class A) quy định một thiết bị đo chất lượng điện năng phải đo như thế nào - độ chính xác, cách tổng hợp theo thời gian (3 s, 10 min, 2 h) và hành vi gắn cờ trong các sự kiện nhiễu loạn. Một thiết bị Class A của nhà cung cấp này phải cho ra kết quả giống hệt về mặt thống kê so với một thiết bị Class A của nhà cung cấp khác trên cùng một dạng sóng. Bất kỳ thiết bị nào dưới Class A (Class S hoặc Class B) đều chấp nhận được cho mục đích theo dõi xu hướng nhưng không nên dùng cho báo cáo tuân thủ hay bằng chứng hợp đồng.
IEEE 519-2022 xác định các con số phải là bao nhiêu. Tại điểm đấu nối chung (PCC) với lưới điện lực:
| Thông số | Giới hạn (trung tâm dữ liệu hạ áp điển hình) | Vì sao quan trọng |
|---|---|---|
| THD điện áp (THD-V) | ≤ 5% | Trên 5% làm suy giảm các thiết bị điện tử nhạy cảm và làm nhảy bypass của UPS |
| Sóng hài điện áp riêng lẻ | ≤ 3% | Rủi ro cộng hưởng ở bậc 5 và 7 |
| TDD dòng điện tại PCC | ≤ 8% (tùy theo tỷ số Isc/IL) | Điện lực có thể áp dụng phạt hoặc từ chối đấu nối mới |
| Mất cân bằng điện áp | ≤ 2% | Trên 2% đẩy nhanh hỏng hóc PSU CNTT ba pha |
| Sai lệch tần số | ± 1% của 50 Hz | Vượt ngoài ngưỡng này, UPS loại bỏ nguồn lưới và chạy bằng ắc quy |
Nếu một hệ thống PQMS không tự động gắn cờ các vi phạm những ngưỡng này, thì nó chưa làm tròn nhiệm vụ. Một Hệ thống Giám sát Chất lượng Điện năng (PQMS) dựa trên nền tảng tiêu chuẩn cần tạo ra các báo cáo IEC 61000-4-30 Class A mà không cần xuất dữ liệu và xử lý hậu kỳ thủ công.
3. Bảy thông số mà một hệ thống PQMS cho trung tâm dữ liệu phải ghi lại
- Điện áp và dòng điện RMS theo từng pha được tổng hợp ở 3 s, 10 min và 2 h. Phép tổng hợp 10 phút là bằng chứng pháp lý cho các tranh chấp với điện lực.
- THD điện áp và dòng điện kèm phổ sóng hài riêng lẻ đến bậc 50. Chỉ giới hạn ở bậc 25 nếu hệ thống PQMS không thể lưu nhiều hơn - nhưng khi đó bạn sẽ bỏ sót các sóng hài tần số đóng cắt từ các máy làm lạnh dẫn động bằng VFD.
- Mất cân bằng điện áp và dòng điện sử dụng phương pháp thành phần đối xứng (tỷ số thành phần thứ tự nghịch thực), không phải phép xấp xỉ đơn giản lấy giá trị lớn nhất trừ trung bình.
- Nhấp nháy (Pst và Plt) theo IEC 61000-4-15. Ít quan trọng hơn đối với tải CNTT nhưng thiết yếu khi một trung tâm dữ liệu dùng chung đường dây trung áp với một khách thuê sản xuất.
- Biến đổi điện áp nhanh, sụt áp và vọt áp với khả năng phát hiện theo từng chu kỳ. Các đường cong ITIC và SEMI F47 cần được tự động phủ chồng lên nhật ký sự kiện.
- Quá độ và xung xuống tới độ phân giải dưới micro giây tại các điểm trọng yếu (đầu vào UPS, cầu chuyển nguồn). Đây chính là điều phân biệt một hệ thống PQMS với một đồng hồ đo điện cơ bản.
- Công suất tác dụng, phản kháng và biểu kiến theo từng pha với hệ số công suất thực và hệ số công suất dịch chuyển được báo cáo riêng biệt. Nhầm lẫn giữa hai đại lượng này là nguyên nhân phổ biến nhất gây sai kích cỡ giàn tụ bù.
Để so sánh sâu hơn về phạm vi giám sát, xem phần phân tích của chúng tôi về EMS so với PQMS - quản lý năng lượng tập trung vào mức tiêu thụ, còn PQMS tập trung vào chất lượng và độ tin cậy.
4. Sóng hài âm thầm bào mòn PUE và công suất CNTT như thế nào
Một ví dụ tính toán cụ thể: một trung tâm dữ liệu có tải CNTT 2 MW vận hành ở mức 8% THD-I tại các đầu vào UPS của nó.
- Tổn hao máy biến áp tăng khoảng 18% so với trường hợp hình sin - tương đương khoảng 22 kW nhiệt thải bổ sung.
- Lượng nhiệt đó phải được loại bỏ bởi hệ thống CRAC/CRAH. Ở hiệu suất cơ học điển hình là 3.5 COP, hình phạt làm mát là thêm 6.3 kW công suất điện đầu vào.
- Tổng tải có thể phòng tránh: ~28 kW liên tục, hoặc khoảng 245 MWh mỗi năm.
- Với mức giá hỗn hợp theo biểu giá thương mại S$0.28/kWh, đó là khoảng S$68 600 mỗi năm chi phí có thể tránh được - trước khi tính đến hình phạt về PUE.
- Cùng tải sóng hài đó làm giảm định mức một máy biến áp 2 500 kVA khoảng 12%, tương đương với việc mất 300 kVA dư địa tăng trưởng CNTT khả dụng.
Không một khoản nào trong số này xuất hiện trên hóa đơn năng lượng dưới dạng một dòng riêng. Nó ẩn bên trong tổng số kilowatt giờ. Một hệ thống PQMS làm lộ rõ điều đó một cách tường minh và cho phép đội ngũ vận hành xây dựng một luận chứng kinh doanh về khắc phục - thường là bộ lọc hoặc thiết bị điều hòa sóng hài chủ động với thời gian hoàn vốn 2–3 năm ở quy mô này.
5. Lắp đặt thiết bị đo ở đâu: MSB, UPS, PDU và phía hạ nguồn
Vị trí đặt cảm biến quan trọng hơn số lượng cảm biến. Một bộ thiết bị đo tối thiểu cho trung tâm dữ liệu bao phủ bốn lớp:
- Đầu vào tủ điện chính (MSB) - điểm đấu nối chung về mặt pháp lý với lưới điện lực. Đồng hồ Class A; đây là thiết bị mà dữ liệu của nó sẽ được viện dẫn trong bất kỳ tranh chấp nào hoặc trong hồ sơ nộp BCA.
- Đầu vào và đầu ra UPS - đồng hồ đầu vào định lượng gánh nặng sóng hài mà trung tâm dữ liệu tạo ra về phía thượng nguồn; đồng hồ đầu ra định lượng chất lượng được cung cấp đến thiết bị CNTT. Độ chênh lệch chính là giá trị mà UPS bổ sung.
- Các nhánh trích từ PDU và busway - giám sát mạch nhánh (BCM) tại điểm cấp nguồn cho rack. Đây là nơi công suất bị mắc kẹt trở nên hiện rõ.
- Máy phát dự phòng và ATS - ghi lại các sự kiện chuyển nguồn với độ phân giải dưới một chu kỳ. Hầu hết các sự cố mất điện CNTT chưa được phát hiện đều truy ngược về một lần chuyển nguồn lỗi tại đây.
Một quy tắc kinh nghiệm không chính thức: một thiết bị Class A cho mỗi chuyển tiếp điện áp (MV → LV → UPS → PDU) và một thiết bị Class S hoặc Class B cho mỗi nhánh hạ nguồn. Cố gắng dùng một thiết bị duy nhất để bao phủ tất cả thì hoặc là chi tiêu quá mức tại rack, hoặc là thiếu thiết bị đo tại đầu vào.
6. Kết nối PQMS với DCIM và BMS để có khả năng quan sát hợp nhất
Một hệ thống PQMS chỉ tồn tại trên chiếc laptop riêng của nó thì chẳng giúp ích cho ai. Các thiết bị hiện đại cung cấp đồng thời Modbus TCP, IEC 61850 GOOSE, MQTT và BACnet/IP, cho phép cùng một tập dữ liệu cấp cho ba đối tượng tiêu thụ khác nhau:
- DCIM cho việc lập kế hoạch công suất và phân bổ chi phí ở cấp rack - hệ thống PQMS đóng góp dòng điện khả dụng "thực" sau khi giảm định mức do sóng hài.
- BMS cho việc leo thang cảnh báo qua bảng điều khiển 24/7 hiện hữu - các đội ngũ vận hành cơ sở không nên cần đến một màn hình giám sát mới.
- Báo cáo Bền vững / ESG - dữ liệu chất lượng điện năng cấp cho việc tinh chỉnh báo cáo Scope 2 và hỗ trợ các hồ sơ nộp theo SS 564 (Tiêu chuẩn Singapore về quản lý năng lượng).
Đây là nơi kiến trúc tích hợp phát huy giá trị của nó. Các giải pháp DCIM và giám sát năng lượng của EcoXplore được thiết kế sao cho dữ liệu PQMS được lưu vào cùng một kho với dữ liệu đo từ xa về làm mát, tải CNTT và BMS - mà không cần screen-scraping hay các tích hợp đơn lẻ tạm bợ.
7. Tuân thủ tại Singapore: SS 638, BCA Green Mark và khung quy định của EMA
Ba khung quy định nội địa định hình những gì mà một hệ thống PQMS cho trung tâm dữ liệu phải tạo ra:
- SS 638:2018 (Bộ Quy tắc Thực hành về lắp đặt điện của Singapore) yêu cầu đánh giá sóng hài đối với bất kỳ công trình lắp đặt nào có tải phi tuyến đáng kể - mọi trung tâm dữ liệu hiện đại đều thuộc diện này.
- BCA Green Mark for New Data Centres trao điểm cho mức độ chi tiết của đo đếm phụ và giám sát thời gian thực hệ thống phân phối điện. Xem bài viết đồng hành của chúng tôi về giám sát năng lượng theo BCA Green Mark để biết hệ thống phân cấp đo đếm phụ.
- EMA Quality of Supply Code xác định các dải điện áp và tần số mà điện lực phải cung cấp - và, qua đó, các dải mà một trung tâm dữ liệu có thể tin cậy về mặt hợp đồng. Một hệ thống PQMS Class A tại PCC là bằng chứng duy nhất được chấp nhận trong một vụ tranh chấp.
Các đơn vị vận hành phục vụ những khách thuê chịu quản lý - ngân hàng theo MAS TRM, y tế theo MOH, chính phủ theo IM8 - nên bổ sung các biện pháp kiểm soát tính toàn vẹn dữ liệu trên chính hệ thống giám sát. Nền tảng giám sát của EcoXplore được xây dựng trên một Hệ thống Quản lý An toàn Thông tin được chứng nhận ISO 27001:2022, nhờ đó chuỗi lưu giữ chứng cứ của dữ liệu đo có thể được kiểm toán đầu cuối.
8. Danh mục hành động dành cho người quản lý cơ sở
- Xác nhận xem đồng hồ đo hiện có của bạn có đạt IEC 61000-4-30 Class A hay không. Nếu không, dữ liệu nó tạo ra không thể bảo vệ bạn trong một vụ tranh chấp với điện lực.
- Bố trí cảm biến tại đầu vào MSB, đầu vào UPS, đầu ra UPS và ít nhất một PDU đại diện.
- Cấu hình phép tổng hợp 10 phút làm bản ghi pháp lý; giữ lại các bộ đệm 3 giây và bắt dạng sóng cho các sự kiện cần điều tra pháp y.
- Đặt các ngưỡng cảnh báo theo giới hạn điện áp và dòng điện của IEEE 519-2022, không theo giá trị mặc định của nhà cung cấp.
- Đưa dữ liệu PQMS vào cùng một kho với DCIM, BMS và các đồng hồ đo phụ năng lượng - các kho dữ liệu rời rạc sẽ làm hỏng mục đích.
- Rà soát hồ sơ sóng hài hàng quý. Tải thay đổi khi mật độ CNTT tăng lên; các ngưỡng được đặt lúc nghiệm thu sẽ trôi dạt theo thời gian.
Trao đổi với đội ngũ
EcoXplore thiết kế và triển khai giám sát chất lượng điện năng IEC 61000-4-30 Class A trên khắp Singapore và Đông Nam Á, tích hợp với các nền tảng DCIM, BMS và quản lý năng lượng. Nếu bạn đang lên kế hoạch xây dựng mới, tái chứng nhận Green Mark, hoặc khắc phục sau một sự cố suýt xảy ra, hãy trao đổi với đội ngũ của chúng tôi - hầu hết các dự án bắt đầu bằng một buổi khảo sát thực địa một ngày và một bản đồ điểm đo.
More About Ecoxplore
We are dedicated to empowering businesses with software and services that drive efficiency and growth
View more

.svg)

.svg)

.svg)
.svg)

More About Ecoxplore
We are dedicated to empowering businesses with software and services that drive efficiency and growth
View moreข้อมูลเพิ่มเติมเกี่ยวกับ Ecoxplore
เรามุ่งมั่นในการช่วยให้ธุรกิจของคุณทำงานได้อย่างมีประสิทธิภาพและเติบโตอย่างยั่งยืนด้วยซอฟต์แวร์และบริการของเรา
ดูเพิ่มเติมMore About Ecoxplore
We are dedicated to empowering businesses with software and services that drive efficiency and growth
View moreLebih Banyak Tentang Ecoxplore
Kami berdedikasi untuk memberdayakan bisnis dengan perangkat lunak dan layanan yang mendorong efisiensi dan pertumbuhan
Lihat lebih banyakMore About Ecoxplore
We are dedicated to empowering businesses with software and services that drive efficiency and growth
View moreLebih Banyak Tentang Ecoxplore
Kami berdedikasi untuk memberdayakan bisnis melalui perangkat lunak dan layanan yang mendorong efisiensi serta pertumbuhan.
Lihat selengkapnyaMore About Ecoxplore
We are dedicated to empowering businesses with software and services that drive efficiency and growth
View moreHiểu thêm về Ecoxplore
Chúng tôi cam kết trao quyền cho các doanh nghiệp bằng phần mềm và dịch vụ giúp tăng cường hiệu quả và phát triển
Xem thêm