


.svg)







Power Quality Monitoring System (PQMS) — What it Measures and Where It Pays Off
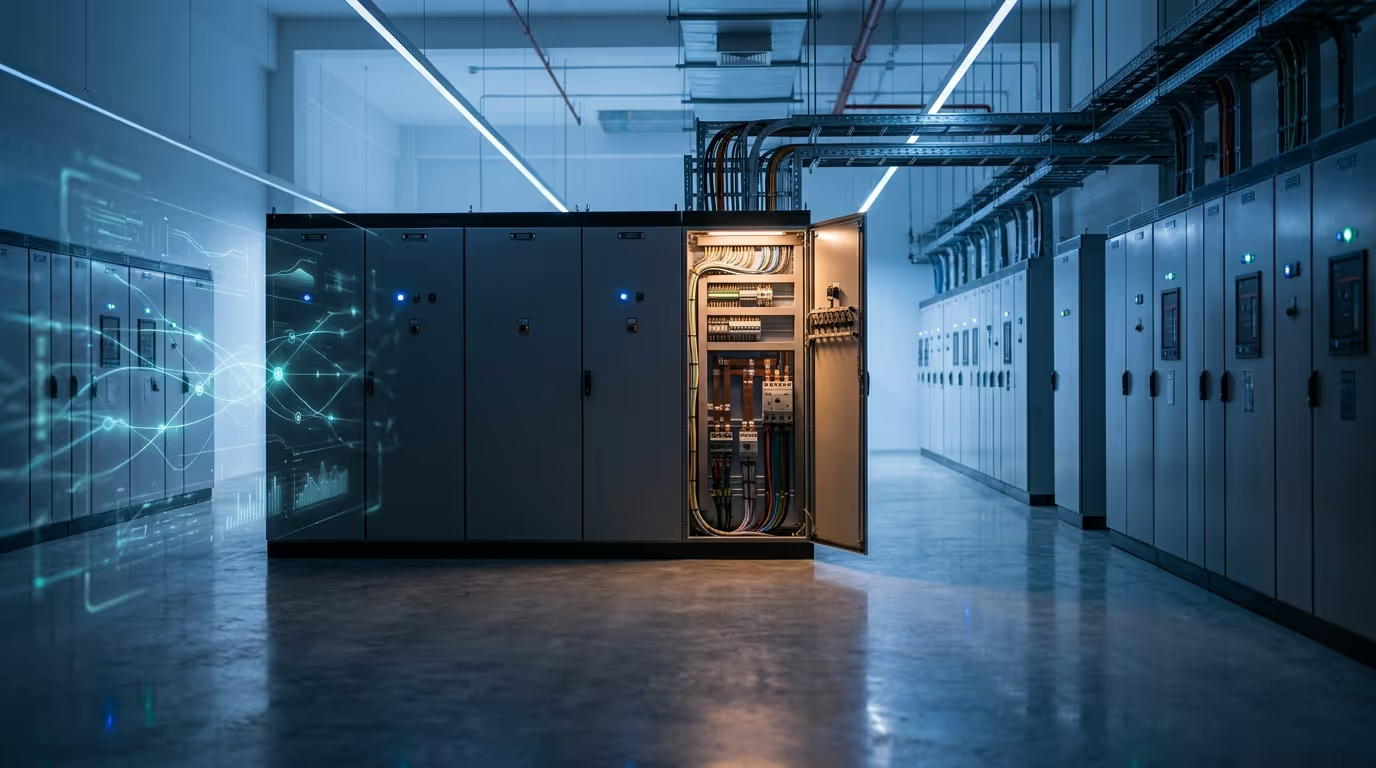
A single voltage sag in a semiconductor fab can scrap a wafer lot worth several hundred thousand dollars. A poorly damped harmonic can trip an MRI mid-scan. The instruments that catch these events before they cost money, or after they cost money so the next one is avoidable, are part of a Power Quality Monitoring System (PQMS).
This page explains what a PQMS measures, the standards it must satisfy in Singapore and the wider Southeast Asia region, how the architecture is typically deployed, and how EcoXplore approaches the work.
Why power quality matters
Modern industrial loads are sensitive in ways their nameplate ratings do not capture. Variable-speed drives draw harmonic current. UPS rectifiers reshape the source waveform. Lithography tools, MRI scanners, and semiconductor steppers have ride-through windows measured in milliseconds.
A 100-millisecond voltage sag, well within the limits of EN 50160, can crash a stepper and scrap an entire wafer batch. The IEEE 1366 reliability indices count the outage; they do not count the production loss. A PQMS is what records the event, classifies it against the relevant standard, and lets the facility engineer reconstruct what tripped, what survived, and why.
For owners pursuing BCA Green Mark certification, ISO 50001 energy management, or the energy disclosure clauses of the Singapore MAS climate-reporting regime, power-quality data is not a nice-to-have. Submetering and PQ logs are part of the evidence pack.
What a PQMS measures
The phenomena tracked by a PQMS fall into a small number of categories, each with a defined measurement method:
| Phenomenon | Definition | Standard / method |
|---|---|---|
| Voltage sag (dip) | RMS voltage drops 10% to 90% of nominal for half a cycle to one minute | IEC 61000-4-30 Class A, 10-cycle window |
| Voltage swell | RMS voltage rises above 110% of nominal | IEC 61000-4-30 Class A |
| Transient (impulsive / oscillatory) | Sub-cycle voltage excursion, often from switching or lightning | IEEE 1159 |
| Harmonic distortion | Periodic distortion of the fundamental waveform | IEC 61000-4-7, expressed as THD and per-harmonic limits per IEEE 519-2022 |
| Voltage unbalance | Differential between phase voltages | IEC 61000-4-30, negative-sequence component |
| Flicker | Visual perception of repetitive voltage modulation | IEC 61000-4-15 |
| Interharmonics | Frequency components between integer harmonics | IEC 61000-4-7 Annex A |
The instrument class matters. IEC 61000-4-30 defines Class A (revenue-grade and compliance-grade), Class S (statistical surveys and screening), and Class B (informational). For binding compliance reporting, Class A is the only safe choice. Class S is fine for site characterisation. Class B is consumer-grade.
Standards and compliance in Southeast Asia
The reference standards for PQMS work in this region cluster around three documents:
IEEE 519-2022 governs harmonic limits at the point of common coupling between a customer and the utility. The 2022 revision tightened TDD (total demand distortion) limits and reframed the assessment window. In Singapore, IEEE 519 compliance is referenced in EMA grid-connection studies for large industrial loads.
EN 50160 describes the voltage characteristics a public network is expected to deliver. It is the European reference often cited by utility-side teams when a customer claims the supply is out of spec. Many SEA utilities, including SP Group in Singapore and TNB in Malaysia, treat EN 50160 as an internal benchmark even where it is not gazetted.
IEC 61000-4-30 is the method standard. It specifies how the meter must aggregate, time-stamp, and report each event. A meter that calls itself Class A but does not implement flagging during sags has not understood the standard. Buyers should verify Class A claims by asking for the manufacturer's IEC 61000-4-30 conformance test report, not just the marketing brochure.
For BCA reporting in Singapore, the Energy Market Authority and BCA both reference these documents in their handbooks. The Building Control Act and the Green Mark NRB:2015 criteria each call out submetering and energy-quality data clauses. EcoXplore's compliance team can help map a site's PQMS deployment to the specific report templates required for annual submission.
Architecture options
PQMS deployments fall into three common patterns, picked based on site scale and integration appetite:
Standalone PQMS. A dedicated Class A meter on each critical feeder, logging locally and pulled over Modbus TCP into a vendor-supplied analytics package. Lowest cost. Lowest integration. Good for small commercial sites or for adding PQ visibility to a single problem area.
SCADA-integrated PQMS. Class A meters feed the existing SCADA historian alongside breaker status, temperature, and other I/O. Events become correlated with operational context (which breaker tripped, which load was online). Best for industrial sites that already run a SCADA platform.
Cloud-aggregated PQMS. Meters publish to a cloud platform (MQTT or vendor API), and dashboards are accessed from anywhere. Useful for portfolios of sites where one engineer covers several locations. Watch for data sovereignty constraints in MY, VN, and ID where regulated data must remain in-country.
The right choice is not the most expensive option. A semiconductor fab does not always need cloud. A multi-site retailer rarely needs SCADA. EcoXplore's pre-deployment review starts from the question of who reads the data and how often, then sizes the architecture down from there.
EcoXplore's approach
EcoXplore is a Singapore-headquartered systems integrator. The PQMS practice runs on three principles:
- Class A or do not bother. Meters that cannot pass IEC 61000-4-30 conformance testing get filtered out of the proposal stage.
- Standards-first reporting. Every dashboard ships with reports keyed to IEEE 519, EN 50160, and the local utility's commissioning template, not generic chart widgets.
- Integration over replacement. Existing BMS, EMS, and SCADA stacks are augmented, not torn out. The bias is toward open protocols (BACnet, Modbus TCP, OPC UA, MQTT).
The team holds BCA ME02 Workhead Grade L4, ISO 9001:2015, ISO 14001:2015, and ISO 45001:2018 certifications, with deployments across Singapore, Thailand, Malaysia, Indonesia, and Vietnam covering data centres, hospitals, pharmaceutical plants, and government buildings.
Typical deployment timelines and budgets
A representative single-site PQMS scope (12 to 20 Class A meters, SCADA-integrated, with a six-month commissioning tail) runs from twelve weeks for design and procurement to a further six to ten weeks for installation, commissioning, and acceptance. Hardware costs are roughly SGD 4,000 to SGD 12,000 per Class A meter point, depending on feeder size and accessory CT requirements. Software and integration scope varies widely with the chosen historian. Budgeting figures are indicative and should be confirmed by a site-specific quotation.
Frequently asked questions
Is PQMS the same as EMS? No. An Energy Management System tracks consumption (kWh, kVA, W.A.G.E.S submetering). A PQMS tracks the quality of the supply (sags, harmonics, transients). The two share hardware where revenue meters offer both measurements, but the reporting and the standards differ. See the dedicated EMS vs PQMS comparison page.
What is the smallest site that needs a PQMS? Any facility where a single PQ event would interrupt revenue. That includes data centres (any size), semiconductor fabs, pharma cleanrooms, hospitals (operating theatres), and broadcast facilities. A typical commercial office building usually does not need one.
Does PQMS data integrate with a BMS? Yes, through BACnet/IP or Modbus TCP for status points and via SQL or OPC UA for event records. The detail of the integration depends on which BMS head-end is in service. See the Building Management System page for the typical patterns.
How often are IEEE 519 compliance reports required? Most utilities require an initial study at grid connection and a re-study only when load profile changes materially. Some larger industrial customers run quarterly summaries internally even when not contractually required, to catch drift.
What ride-through performance should equipment specify? ITIC and CBEMA curves are the usual references for IT and process equipment respectively. Each defines an envelope of voltage and duration the equipment is expected to tolerate without disturbance.
Talk to EcoXplore's engineering team
For a site review, a budgetary proposal, or a sample dashboard walkthrough, contact the EcoXplore team. Initial site reviews for Singapore and Johor are typically completed within two weeks.



电能质量监测系统(PQMS):它监测什么,以及在哪里能带来回报
半导体晶圆厂中一次电压暂降,就可能报废一批价值数十万美元的晶圆。一次阻尼不足的谐波,可能让 MRI 在扫描中途跳机。能够在这些事件造成损失之前将其捕捉,或在造成损失之后将其记录下来以避免下一次重演的仪器,正是电能质量监测系统(PQMS)的组成部分。
本页将说明 PQMS 监测什么、它在新加坡及更广泛的东南亚地区必须满足哪些标准、其架构通常如何部署,以及 EcoXplore 如何开展这项工作。
为什么电能质量很重要
现代工业负载的敏感性,往往是其铭牌参数无法体现的。变频驱动器会产生谐波电流。UPS 整流器会重塑电源波形。光刻设备、MRI 扫描仪和半导体步进机的可承受穿越窗口,以毫秒计。
一次 100 毫秒的电压暂降,完全在 EN 50160 的限值之内,却可能令步进机崩溃,并报废整批晶圆。IEEE 1366 可靠性指标只统计停电次数,并不统计生产损失。PQMS 正是用来记录该事件、依据相关标准对其进行分类,并让设施工程师得以重建出究竟是什么跳了机、什么挺住了、以及原因何在。
对于争取 BCA Green Mark 认证、ISO 50001 能源管理,或新加坡 MAS 气候披露制度下能源披露条款的业主而言,电能质量数据并非可有可无。分项计量与 PQ 日志,都是证据材料的一部分。
PQMS 监测什么
PQMS 所跟踪的现象可归为少数几类,每一类都有明确的测量方法:
| 现象 | 定义 | 标准 / 方法 |
|---|---|---|
| 电压暂降(凹陷) | RMS 电压在半个周期至一分钟内降至额定值的 10% 至 90% | IEC 61000-4-30 A 级,10 周期窗口 |
| 电压暂升 | RMS 电压升至额定值的 110% 以上 | IEC 61000-4-30 A 级 |
| 瞬变(脉冲型 / 振荡型) | 低于一个周期的电压偏移,常源于开关操作或雷击 | IEEE 1159 |
| 谐波畸变 | 对基波波形的周期性畸变 | IEC 61000-4-7,以 THD 表示,并依 IEEE 519-2022 设定各次谐波限值 |
| 电压不平衡 | 各相电压之间的差异 | IEC 61000-4-30,负序分量 |
| 闪变 | 对重复性电压调制的视觉感知 | IEC 61000-4-15 |
| 间谐波 | 处于整数次谐波之间的频率分量 | IEC 61000-4-7 附录 A |
仪器等级很重要。IEC 61000-4-30 定义了 A 级(计费级与合规级)、S 级(统计调查与筛查)以及 B 级(信息参考级)。对于具有约束力的合规报告,A 级是唯一稳妥的选择。S 级适用于现场特性分析。B 级则属于消费级。
东南亚的标准与合规
本地区 PQMS 工作的参考标准主要围绕三份文件:
IEEE 519-2022 规范客户与公用电网之间公共连接点处的谐波限值。2022 年修订版收紧了 TDD(总需求畸变)限值,并重新界定了评估窗口。在新加坡,针对大型工业负载的 EMA 并网研究中会引用 IEEE 519 合规要求。
EN 50160 描述了公共电网预期应提供的电压特性。当客户声称供电不达标时,公用电网侧团队常引用这份欧洲标准作为参考。许多东南亚公用事业公司,包括新加坡的 SP Group 和马来西亚的 TNB,即使在并未将 EN 50160 正式列为法定标准的情况下,也将其视为内部基准。
IEC 61000-4-30 是方法标准。它规定了仪表必须如何聚合、加盖时间戳并报告每一次事件。一台自称 A 级却未在暂降期间实现标记功能的仪表,并未真正理解该标准。买方应通过索取制造商的 IEC 61000-4-30 一致性测试报告来验证 A 级声明,而不应仅凭营销宣传册。
对于新加坡的 BCA 报告,能源市场管理局(EMA)和 BCA 都在各自的手册中引用了这些文件。《建筑管制法》(Building Control Act)与 Green Mark NRB:2015 准则均明确列出了分项计量与能源质量数据条款。EcoXplore 的合规团队可协助将现场的 PQMS 部署映射到年度提交所需的具体报告模板。
架构选型
PQMS 部署可归为三种常见模式,依据现场规模与集成意愿来选择:
独立式 PQMS。在每条关键馈线上配置专用 A 级仪表,本地记录数据,并通过 Modbus TCP 接入供应商提供的分析软件包。成本最低,集成度最低。适用于小型商业场所,或为单一问题区域增添 PQ 可见性。
SCADA 集成式 PQMS。A 级仪表与断路器状态、温度及其他 I/O 一同接入现有的 SCADA 历史数据库。事件由此与运行背景产生关联(哪台断路器跳闸、哪个负载在线)。最适合已运行 SCADA 平台的工业场所。
云端聚合式 PQMS。仪表向云平台(MQTT 或供应商 API)发布数据,仪表盘可随处访问。适用于由一名工程师管理多个地点的多场所组合。需留意 MY、VN 和 ID 的数据主权约束,这些地区受监管的数据必须留在境内。
正确的选择并非最昂贵的方案。半导体晶圆厂并不总是需要云端。多门店零售商则很少需要 SCADA。EcoXplore 的部署前评估,从“谁来读取数据、读取频率如何”这一问题出发,再据此向下确定架构规模。
EcoXplore 的方法
EcoXplore 是一家总部位于新加坡的系统集成商。其 PQMS 业务遵循三项原则:
- 非 A 级不考虑。无法通过 IEC 61000-4-30 一致性测试的仪表,在方案阶段即被筛除。
- 标准先行的报告。每一套仪表盘交付时,都配有以 IEEE 519、EN 50160 及当地公用事业调试模板为基准的报告,而非通用图表组件。
- 集成而非替换。对现有的 BMS、EMS 和 SCADA 体系进行增强,而非拆除重建。倾向于采用开放协议(BACnet、Modbus TCP、OPC UA、MQTT)。
该团队持有 BCA ME02 工种等级 L4、ISO 9001:2015、ISO 14001:2015 及 ISO 45001:2018 认证,部署项目遍及新加坡、泰国、马来西亚、印度尼西亚和越南,涵盖数据中心、医院、制药厂和政府建筑。
典型的部署周期与预算
一个具有代表性的单场所 PQMS 范围(12 至 20 个 A 级仪表,SCADA 集成,带六个月的调试收尾期),从设计与采购的十二周,到再加上六至十周的安装、调试与验收。硬件成本约为每个 A 级仪表点 4,000 至 12,000 新元,具体取决于馈线规模与附件 CT 需求。软件与集成范围因所选历史数据库而差异巨大。预算数字仅供参考,应以针对具体现场的报价为准。
常见问题
PQMS 与 EMS 是一回事吗?不是。能源管理系统跟踪能耗(kWh、kVA、W.A.G.E.S 分项计量)。PQMS 则跟踪供电的质量(暂降、谐波、瞬变)。当计费仪表同时提供两类测量时,二者会共用硬件,但报告与标准各不相同。请参阅专门的 EMS 与 PQMS 对比页面。
需要 PQMS 的最小场所是多大?任何一次 PQ 事件就会中断营收的设施都需要。这包括数据中心(任何规模)、半导体晶圆厂、制药洁净室、医院(手术室)以及广播设施。一般的商业办公楼通常不需要。
PQMS 数据能与 BMS 集成吗?可以,状态点通过 BACnet/IP 或 Modbus TCP,事件记录则通过 SQL 或 OPC UA。集成的具体细节取决于正在使用的是哪种 BMS 前端。常见模式请参阅楼宇管理系统页面。
IEEE 519 合规报告需要多久出具一次?大多数公用事业公司要求在并网时进行一次初始研究,仅在负载特性发生重大变化时才重新研究。一些较大的工业客户即便在合同上并无要求,也会在内部按季度做汇总,以便及时发现漂移。
设备应规定怎样的穿越性能?ITIC 与 CBEMA 曲线分别是 IT 设备与工艺设备的常用参考。两者各自界定了一个电压与持续时间的包络范围,设备应能在其中承受而不受扰动。
联系 EcoXplore 工程团队
如需现场评估、预算方案,或样例仪表盘演示,请联系 EcoXplore 团队。针对新加坡和柔佛(Johor)的初步现场评估通常在两周内完成。
ระบบตรวจวัดคุณภาพไฟฟ้า (PQMS) วัดอะไรบ้างและคุ้มค่าตรงไหน
แรงดันไฟฟ้าตกเพียงครั้งเดียวในโรงงานผลิตเซมิคอนดักเตอร์อาจทำให้เวเฟอร์ทั้งล็อตมูลค่าหลายแสนดอลลาร์กลายเป็นของเสียได้ ฮาร์มอนิกที่หน่วงไม่ดีพออาจทำให้เครื่อง MRI หยุดทำงานกลางการสแกน อุปกรณ์ที่ตรวจจับเหตุการณ์เหล่านี้ได้ก่อนที่จะสร้างความเสียหายเป็นเม็ดเงิน หรือหลังจากเกิดความเสียหายแล้วเพื่อให้ป้องกันครั้งต่อไปได้ ล้วนเป็นส่วนหนึ่งของระบบตรวจวัดคุณภาพไฟฟ้า (PQMS)
หน้านี้อธิบายว่า PQMS วัดอะไรบ้าง มาตรฐานที่ต้องเป็นไปตามในสิงคโปร์และในภูมิภาคเอเชียตะวันออกเฉียงใต้โดยรวม รูปแบบการติดตั้งสถาปัตยกรรมระบบที่ใช้กันโดยทั่วไป และแนวทางการดำเนินงานของ EcoXplore
เหตุใดคุณภาพไฟฟ้าจึงสำคัญ
โหลดทางอุตสาหกรรมยุคใหม่มีความอ่อนไหวในแบบที่ค่าพิกัดบนเนมเพลตไม่ได้บ่งบอกไว้ ไดรฟ์ปรับความเร็วรอบดึงกระแสฮาร์มอนิก เครื่องเรียงกระแสของ UPS เปลี่ยนรูปคลื่นของแหล่งจ่าย เครื่องลิโทกราฟี เครื่องสแกน MRI และเครื่องสเต็ปเปอร์สำหรับเซมิคอนดักเตอร์มีช่วงทนต่อการรบกวน (ride-through) ที่วัดกันในระดับมิลลิวินาที
แรงดันไฟฟ้าตก 100 มิลลิวินาที ซึ่งยังอยู่ในขอบเขตของ EN 50160 อาจทำให้เครื่องสเต็ปเปอร์หยุดทำงานและทำให้เวเฟอร์ทั้งแบตช์กลายเป็นของเสียได้ ดัชนีความเชื่อถือได้ตาม IEEE 1366 นับเฉพาะการขัดข้องของไฟฟ้า แต่ไม่ได้นับความสูญเสียด้านการผลิต PQMS คือสิ่งที่บันทึกเหตุการณ์ จำแนกประเภทเทียบกับมาตรฐานที่เกี่ยวข้อง และให้วิศวกรประจำอาคารสามารถสร้างภาพย้อนหลังได้ว่าอะไรที่หยุดทำงาน อะไรที่ยังทำงานต่อได้ และเพราะเหตุใด
สำหรับเจ้าของอาคารที่ต้องการขอการรับรอง BCA Green Mark การจัดการพลังงานตาม ISO 50001 หรือข้อกำหนดการเปิดเผยข้อมูลพลังงานภายใต้ระบบการรายงานด้านสภาพภูมิอากาศของ Singapore MAS ข้อมูลคุณภาพไฟฟ้าไม่ใช่เพียงสิ่งที่มีก็ดี การวัดย่อย (submetering) และบันทึก PQ เป็นส่วนหนึ่งของชุดหลักฐาน
PQMS วัดอะไรบ้าง
ปรากฏการณ์ที่ PQMS ติดตามนั้นแบ่งออกได้เป็นไม่กี่ประเภท โดยแต่ละประเภทมีวิธีการวัดที่กำหนดไว้:
| ปรากฏการณ์ | นิยาม | มาตรฐาน / วิธีการ |
|---|---|---|
| แรงดันไฟฟ้าตก (sag/dip) | แรงดัน RMS ลดลงเหลือ 10% ถึง 90% ของค่าพิกัดเป็นเวลาตั้งแต่ครึ่งรอบคลื่นจนถึงหนึ่งนาที | IEC 61000-4-30 Class A หน้าต่างวัด 10 รอบคลื่น |
| แรงดันไฟฟ้าเกิน (swell) | แรงดัน RMS เพิ่มสูงกว่า 110% ของค่าพิกัด | IEC 61000-4-30 Class A |
| ทรานเซียนต์ (แบบกระชาก / แบบแกว่ง) | การเบี่ยงเบนของแรงดันในช่วงต่ำกว่าหนึ่งรอบคลื่น มักเกิดจากการสวิตชิงหรือฟ้าผ่า | IEEE 1159 |
| ความเพี้ยนฮาร์มอนิก | การผิดเพี้ยนเป็นคาบของรูปคลื่นพื้นฐาน | IEC 61000-4-7 แสดงผลเป็น THD และขีดจำกัดรายฮาร์มอนิกตาม IEEE 519-2022 |
| แรงดันไม่สมดุล | ความแตกต่างระหว่างแรงดันแต่ละเฟส | IEC 61000-4-30 องค์ประกอบลำดับลบ |
| แสงกะพริบ (flicker) | การรับรู้ทางสายตาต่อการมอดูลเตแรงดันแบบซ้ำ ๆ | IEC 61000-4-15 |
| อินเตอร์ฮาร์มอนิก | องค์ประกอบความถี่ที่อยู่ระหว่างฮาร์มอนิกจำนวนเต็ม | IEC 61000-4-7 ภาคผนวก A |
ระดับชั้น (class) ของอุปกรณ์เป็นเรื่องสำคัญ IEC 61000-4-30 กำหนด Class A (ระดับสำหรับการเรียกเก็บค่าไฟและการตรวจสอบความสอดคล้อง) Class S (สำหรับการสำรวจเชิงสถิติและการคัดกรอง) และ Class B (สำหรับข้อมูลทั่วไป) สำหรับการรายงานความสอดคล้องที่มีผลผูกพัน Class A เป็นทางเลือกเดียวที่ปลอดภัย Class S เหมาะสำหรับการสำรวจคุณลักษณะของไซต์งาน ส่วน Class B เป็นเกรดสำหรับผู้บริโภคทั่วไป
มาตรฐานและความสอดคล้องในภูมิภาคเอเชียตะวันออกเฉียงใต้
มาตรฐานอ้างอิงสำหรับงาน PQMS ในภูมิภาคนี้รวมกลุ่มอยู่รอบเอกสารสามฉบับ:
IEEE 519-2022 กำกับขีดจำกัดฮาร์มอนิก ณ จุดเชื่อมต่อร่วม (point of common coupling) ระหว่างผู้ใช้ไฟกับการไฟฟ้า ฉบับปรับปรุงปี 2022 ได้เข้มงวดขีดจำกัด TDD (total demand distortion) ขึ้นและปรับกรอบหน้าต่างการประเมินใหม่ ในสิงคโปร์ ความสอดคล้องตาม IEEE 519 ถูกอ้างอิงในการศึกษาการเชื่อมต่อโครงข่ายของ EMA สำหรับโหลดอุตสาหกรรมขนาดใหญ่
EN 50160 อธิบายคุณลักษณะของแรงดันที่โครงข่ายสาธารณะคาดว่าจะจ่ายได้ เป็นมาตรฐานอ้างอิงของยุโรปที่ทีมฝั่งการไฟฟ้ามักหยิบยกขึ้นมาเมื่อลูกค้าอ้างว่าแหล่งจ่ายไฟไม่เป็นไปตามข้อกำหนด การไฟฟ้าหลายแห่งในเอเชียตะวันออกเฉียงใต้ รวมถึง SP Group ในสิงคโปร์และ TNB ในมาเลเซีย ใช้ EN 50160 เป็นเกณฑ์มาตรฐานภายในแม้ในที่ที่ยังไม่ได้ประกาศใช้เป็นกฎหมาย
IEC 61000-4-30 เป็นมาตรฐานด้านวิธีการ ซึ่งระบุว่ามิเตอร์ต้องรวมผล ประทับเวลา และรายงานแต่ละเหตุการณ์อย่างไร มิเตอร์ที่อ้างว่าเป็น Class A แต่ไม่ได้ทำการตั้งค่าสถานะ (flagging) ระหว่างเกิดแรงดันตก แสดงว่ายังไม่เข้าใจมาตรฐานนี้ ผู้ซื้อควรตรวจสอบคำกล่าวอ้าง Class A โดยการขอรายงานผลการทดสอบความสอดคล้องตาม IEC 61000-4-30 ของผู้ผลิต ไม่ใช่เพียงโบรชัวร์การตลาด
สำหรับการรายงานต่อ BCA ในสิงคโปร์ ทั้ง Energy Market Authority และ BCA ต่างอ้างอิงเอกสารเหล่านี้ในคู่มือของตน Building Control Act และเกณฑ์ Green Mark NRB:2015 ต่างระบุข้อกำหนดเกี่ยวกับการวัดย่อยและข้อมูลคุณภาพพลังงานไว้ ทีมงานด้านความสอดคล้องของ EcoXplore สามารถช่วยจับคู่การติดตั้ง PQMS ของไซต์งานเข้ากับเทมเพลตรายงานเฉพาะที่จำเป็นต้องใช้สำหรับการยื่นประจำปีได้
ทางเลือกด้านสถาปัตยกรรมระบบ
การติดตั้ง PQMS แบ่งออกเป็นสามรูปแบบที่พบได้ทั่วไป ซึ่งเลือกใช้ตามขนาดของไซต์งานและความต้องการในการเชื่อมต่อระบบ:
PQMS แบบสแตนด์อโลน มิเตอร์ Class A เฉพาะตัวบนฟีดเดอร์สำคัญแต่ละจุด บันทึกข้อมูลในเครื่องและดึงผ่าน Modbus TCP เข้าสู่แพ็กเกจวิเคราะห์ข้อมูลที่ผู้จำหน่ายจัดเตรียมให้ ต้นทุนต่ำที่สุด การเชื่อมต่อระบบน้อยที่สุด เหมาะสำหรับไซต์งานเชิงพาณิชย์ขนาดเล็กหรือสำหรับการเพิ่มการมองเห็นข้อมูล PQ ในจุดที่มีปัญหาจุดเดียว
PQMS ที่บูรณาการกับ SCADA มิเตอร์ Class A ป้อนข้อมูลเข้าสู่ระบบบันทึกประวัติ (historian) ของ SCADA ที่มีอยู่ ควบคู่ไปกับสถานะเบรกเกอร์ อุณหภูมิ และ I/O อื่น ๆ เหตุการณ์ต่าง ๆ จะถูกเชื่อมโยงกับบริบทการปฏิบัติงาน (เบรกเกอร์ตัวใดที่ทริป โหลดใดที่ออนไลน์อยู่) เหมาะที่สุดสำหรับไซต์งานอุตสาหกรรมที่ใช้แพลตฟอร์ม SCADA อยู่แล้ว
PQMS ที่รวมข้อมูลบนคลาวด์ มิเตอร์ส่งข้อมูลขึ้นสู่แพลตฟอร์มคลาวด์ (MQTT หรือ API ของผู้จำหน่าย) และเข้าถึงแดชบอร์ดได้จากทุกที่ มีประโยชน์สำหรับพอร์ตโฟลิโอของไซต์งานหลายแห่งที่วิศวกรคนเดียวดูแลหลายสถานที่ พึงระวังข้อจำกัดด้านอธิปไตยของข้อมูลในมาเลเซีย เวียดนาม และอินโดนีเซีย ที่ข้อมูลซึ่งอยู่ภายใต้การกำกับดูแลต้องเก็บไว้ภายในประเทศ
ทางเลือกที่ถูกต้องไม่ใช่ตัวเลือกที่แพงที่สุด โรงงานเซมิคอนดักเตอร์ไม่จำเป็นต้องใช้คลาวด์เสมอไป ร้านค้าปลีกหลายสาขาแทบไม่จำเป็นต้องใช้ SCADA การทบทวนก่อนการติดตั้งของ EcoXplore เริ่มต้นจากคำถามที่ว่าใครเป็นผู้อ่านข้อมูลและบ่อยแค่ไหน จากนั้นจึงกำหนดขนาดของสถาปัตยกรรมลงมาจากจุดนั้น
แนวทางของ EcoXplore
EcoXplore เป็นผู้รวมระบบ (systems integrator) ที่มีสำนักงานใหญ่อยู่ในสิงคโปร์ แนวปฏิบัติด้าน PQMS ดำเนินงานบนหลักการสามประการ:
- Class A เท่านั้น มิฉะนั้นก็ไม่ต้องเสียเวลา มิเตอร์ที่ไม่สามารถผ่านการทดสอบความสอดคล้องตาม IEC 61000-4-30 จะถูกคัดออกตั้งแต่ขั้นตอนการเสนอราคา
- การรายงานโดยยึดมาตรฐานเป็นหลัก ทุกแดชบอร์ดจัดส่งพร้อมรายงานที่อ้างอิงกับ IEEE 519, EN 50160 และเทมเพลตการทดสอบเดินเครื่องของการไฟฟ้าท้องถิ่น ไม่ใช่วิดเจ็ตกราฟทั่วไป
- บูรณาการแทนการรื้อเปลี่ยน ระบบ BMS, EMS และ SCADA ที่มีอยู่จะได้รับการเสริมประสิทธิภาพ ไม่ใช่ถูกรื้อทิ้ง โดยมีแนวทางที่เน้นโปรโตคอลแบบเปิด (BACnet, Modbus TCP, OPC UA, MQTT)
ทีมงานได้รับการรับรอง BCA ME02 Workhead Grade L4, ISO 9001:2015, ISO 14001:2015 และ ISO 45001:2018 พร้อมโครงการที่ติดตั้งทั่วสิงคโปร์ ไทย มาเลเซีย อินโดนีเซีย และเวียดนาม ครอบคลุมศูนย์ข้อมูล โรงพยาบาล โรงงานยา และอาคารราชการ
ระยะเวลาและงบประมาณการติดตั้งโดยทั่วไป
ขอบเขตงาน PQMS สำหรับไซต์งานเดียวที่เป็นตัวแทนทั่วไป (มิเตอร์ Class A จำนวน 12 ถึง 20 ตัว บูรณาการกับ SCADA พร้อมช่วงทดสอบเดินเครื่องหกเดือน) ใช้เวลาตั้งแต่สิบสองสัปดาห์สำหรับการออกแบบและการจัดซื้อ ไปจนถึงอีกหกถึงสิบสัปดาห์สำหรับการติดตั้ง การทดสอบเดินเครื่อง และการตรวจรับงาน ต้นทุนฮาร์ดแวร์อยู่ที่ราว SGD 4,000 ถึง SGD 12,000 ต่อจุดมิเตอร์ Class A หนึ่งจุด ขึ้นอยู่กับขนาดฟีดเดอร์และความต้องการอุปกรณ์เสริมประเภท CT ขอบเขตงานซอฟต์แวร์และการบูรณาการระบบแตกต่างกันมากตามระบบบันทึกประวัติที่เลือกใช้ ตัวเลขงบประมาณเป็นเพียงค่าโดยประมาณและควรได้รับการยืนยันด้วยใบเสนอราคาเฉพาะของแต่ละไซต์งาน
คำถามที่พบบ่อย
PQMS เหมือนกับ EMS หรือไม่ ไม่เหมือน ระบบจัดการพลังงาน ติดตามการใช้พลังงาน (kWh, kVA, การวัดย่อย W.A.G.E.S) ส่วน PQMS ติดตามคุณภาพของแหล่งจ่ายไฟ (แรงดันตก ฮาร์มอนิก ทรานเซียนต์) ทั้งสองระบบใช้ฮาร์ดแวร์ร่วมกันในกรณีที่มิเตอร์สำหรับเรียกเก็บค่าไฟวัดได้ทั้งสองอย่าง แต่การรายงานและมาตรฐานนั้นแตกต่างกัน ดูได้ที่หน้าเปรียบเทียบ EMS กับ PQMS โดยเฉพาะ
ไซต์งานที่เล็กที่สุดที่จำเป็นต้องใช้ PQMS คือขนาดใด สถานที่ใดก็ตามที่เหตุการณ์ PQ เพียงครั้งเดียวจะทำให้รายได้สะดุดได้ ซึ่งรวมถึงศูนย์ข้อมูล (ทุกขนาด) โรงงานผลิตเซมิคอนดักเตอร์ ห้องสะอาดของโรงงานยา โรงพยาบาล (ห้องผ่าตัด) และสถานีออกอากาศ อาคารสำนักงานเชิงพาณิชย์ทั่วไปมักไม่จำเป็นต้องใช้
ข้อมูล PQMS บูรณาการกับ BMS ได้หรือไม่ ได้ ผ่าน BACnet/IP หรือ Modbus TCP สำหรับจุดสถานะ และผ่าน SQL หรือ OPC UA สำหรับบันทึกเหตุการณ์ รายละเอียดของการบูรณาการขึ้นอยู่กับว่าใช้ส่วนหัว (head-end) ของ BMS ตัวใด ดูรูปแบบที่ใช้กันทั่วไปได้ที่หน้าระบบบริหารจัดการอาคาร
ต้องจัดทำรายงานความสอดคล้องตาม IEEE 519 บ่อยแค่ไหน การไฟฟ้าส่วนใหญ่กำหนดให้มีการศึกษาเบื้องต้น ณ การเชื่อมโยงโครงข่าย และศึกษาซ้ำเฉพาะเมื่อโปรไฟล์โหลดเปลี่ยนแปลงอย่างมีนัยสำคัญเท่านั้น ลูกค้าอุตสาหกรรมรายใหญ่บางรายจัดทำสรุปรายไตรมาสภายในองค์กรแม้ไม่ได้มีข้อผูกพันตามสัญญา เพื่อจับการเบี่ยงเบนที่ค่อย ๆ เกิดขึ้น
อุปกรณ์ควรระบุสมรรถนะการทนต่อการรบกวน (ride-through) ไว้อย่างไร เส้นโค้ง ITIC และ CBEMA เป็นมาตรฐานอ้างอิงที่ใช้กันทั่วไปสำหรับอุปกรณ์ไอทีและอุปกรณ์กระบวนการตามลำดับ แต่ละเส้นกำหนดขอบเขตของแรงดันและระยะเวลาที่คาดว่าอุปกรณ์จะทนได้โดยไม่เกิดการรบกวน
ปรึกษาทีมวิศวกรรมของ EcoXplore
สำหรับการทบทวนไซต์งาน ข้อเสนอด้านงบประมาณ หรือการสาธิตแดชบอร์ดตัวอย่าง โปรดติดต่อทีมงาน EcoXplore โดยทั่วไปการทบทวนไซต์งานเบื้องต้นสำหรับสิงคโปร์และยะโฮร์จะแล้วเสร็จภายในสองสัปดาห์
Power Quality Monitoring System (PQMS): Apa yang Diukur dan di Mana Manfaatnya
Satu penurunan tegangan (voltage sag) di sebuah fab semikonduktor dapat merusak satu lot wafer senilai beberapa ratus ribu dolar. Harmonik yang teredam dengan buruk dapat menghentikan pemindaian MRI di tengah proses. Instrumen yang menangkap peristiwa ini sebelum menimbulkan kerugian, atau setelah menimbulkan kerugian sehingga kejadian berikutnya dapat dihindari, merupakan bagian dari Power Quality Monitoring System (PQMS).
Halaman ini menjelaskan apa yang diukur sebuah PQMS, standar yang harus dipenuhinya di Singapura dan kawasan Asia Tenggara yang lebih luas, bagaimana arsitekturnya biasanya diterapkan, serta bagaimana EcoXplore menangani pekerjaan tersebut.
Mengapa kualitas daya penting
Beban industri modern bersifat sensitif dengan cara yang tidak tercermin pada rating papan namanya. Variable-speed drive menarik arus harmonik. Penyearah UPS membentuk ulang gelombang sumber. Perkakas litografi, pemindai MRI, dan stepper semikonduktor memiliki jendela ride-through yang diukur dalam milidetik.
Sebuah voltage sag sepanjang 100 milidetik, yang masih berada dalam batas EN 50160, dapat membuat sebuah stepper crash dan merusak satu batch wafer secara keseluruhan. Indeks keandalan IEEE 1366 menghitung pemadaman; indeks tersebut tidak menghitung kerugian produksi. PQMS adalah yang merekam peristiwa tersebut, mengklasifikasikannya terhadap standar yang relevan, dan memungkinkan insinyur fasilitas merekonstruksi apa yang trip, apa yang bertahan, dan mengapa.
Bagi pemilik yang mengejar sertifikasi BCA Green Mark, manajemen energi ISO 50001, atau klausul pengungkapan energi dalam rezim pelaporan iklim Singapore MAS, data kualitas daya bukanlah sekadar pelengkap. Submetering dan log PQ merupakan bagian dari paket bukti.
Apa yang diukur sebuah PQMS
Fenomena yang dilacak oleh sebuah PQMS terbagi ke dalam sejumlah kecil kategori, masing-masing dengan metode pengukuran yang terdefinisi:
| Fenomena | Definisi | Standar / metode |
|---|---|---|
| Voltage sag (dip) | Tegangan RMS turun 10% hingga 90% dari nominal selama setengah siklus hingga satu menit | IEC 61000-4-30 Class A, jendela 10-cycle |
| Voltage swell | Tegangan RMS naik di atas 110% dari nominal | IEC 61000-4-30 Class A |
| Transient (impulsif / osilatori) | Eksursi tegangan sub-siklus, sering kali akibat switching atau petir | IEEE 1159 |
| Distorsi harmonik | Distorsi periodik pada gelombang fundamental | IEC 61000-4-7, dinyatakan sebagai THD dan batas per-harmonik menurut IEEE 519-2022 |
| Ketidakseimbangan tegangan | Selisih antartegangan fasa | IEC 61000-4-30, komponen urutan negatif |
| Flicker | Persepsi visual terhadap modulasi tegangan berulang | IEC 61000-4-15 |
| Interharmonik | Komponen frekuensi di antara harmonik integer | IEC 61000-4-7 Annex A |
Kelas instrumen itu penting. IEC 61000-4-30 mendefinisikan Class A (kelas revenue-grade dan compliance-grade), Class S (survei statistik dan penyaringan), serta Class B (informasional). Untuk pelaporan kepatuhan yang mengikat, Class A adalah satu-satunya pilihan yang aman. Class S memadai untuk karakterisasi lokasi. Class B adalah kelas konsumen.
Standar dan kepatuhan di Asia Tenggara
Standar acuan untuk pekerjaan PQMS di kawasan ini berpusat pada tiga dokumen:
IEEE 519-2022 mengatur batas harmonik pada titik kopling bersama (point of common coupling) antara pelanggan dan utilitas. Revisi 2022 memperketat batas TDD (total demand distortion) dan menata ulang jendela penilaian. Di Singapura, kepatuhan IEEE 519 diacu dalam studi koneksi jaringan EMA untuk beban industri besar.
EN 50160 menjelaskan karakteristik tegangan yang diharapkan dapat disuplai oleh jaringan publik. Ini adalah acuan Eropa yang sering dikutip oleh tim sisi utilitas ketika seorang pelanggan mengklaim suplainya berada di luar spesifikasi. Banyak utilitas di Asia Tenggara, termasuk SP Group di Singapura dan TNB di Malaysia, memperlakukan EN 50160 sebagai tolok ukur internal bahkan di tempat yang belum mengundangkannya.
IEC 61000-4-30 adalah standar metode. Standar ini menetapkan bagaimana meter harus mengagregasi, memberi cap waktu, dan melaporkan setiap peristiwa. Sebuah meter yang menyebut dirinya Class A tetapi tidak menerapkan flagging selama sag berarti belum memahami standar tersebut. Pembeli sebaiknya memverifikasi klaim Class A dengan meminta laporan uji kesesuaian (conformance test report) IEC 61000-4-30 dari pabrikan, bukan sekadar brosur pemasaran.
Untuk pelaporan BCA di Singapura, Energy Market Authority dan BCA sama-sama mengacu pada dokumen-dokumen ini dalam buku panduan mereka. Building Control Act dan kriteria Green Mark NRB:2015 masing-masing menyebutkan klausul submetering dan data kualitas energi. Tim kepatuhan EcoXplore dapat membantu memetakan penerapan PQMS sebuah lokasi ke templat laporan spesifik yang dipersyaratkan untuk pengajuan tahunan.
Opsi arsitektur
Penerapan PQMS terbagi ke dalam tiga pola umum, dipilih berdasarkan skala lokasi dan minat integrasi:
PQMS standalone. Satu meter Class A khusus pada setiap feeder kritis, mencatat secara lokal dan ditarik melalui Modbus TCP ke dalam paket analitik yang disediakan vendor. Biaya terendah. Integrasi terendah. Cocok untuk lokasi komersial kecil atau untuk menambah visibilitas PQ pada satu area bermasalah.
PQMS terintegrasi SCADA. Meter Class A memasok historian SCADA yang sudah ada bersama status pemutus (breaker), suhu, dan I/O lainnya. Peristiwa menjadi terkorelasi dengan konteks operasional (pemutus mana yang trip, beban mana yang online). Terbaik untuk lokasi industri yang sudah menjalankan platform SCADA.
PQMS teragregasi cloud. Meter mempublikasikan ke platform cloud (MQTT atau API vendor), dan dashboard dapat diakses dari mana saja. Berguna untuk portofolio lokasi di mana satu insinyur menangani beberapa lokasi. Perhatikan kendala kedaulatan data di MY, VN, dan ID di mana data yang diregulasi harus tetap berada di dalam negeri.
Pilihan yang tepat bukanlah opsi yang paling mahal. Sebuah fab semikonduktor tidak selalu membutuhkan cloud. Peritel multi-lokasi jarang membutuhkan SCADA. Tinjauan pra-penerapan EcoXplore dimulai dari pertanyaan tentang siapa yang membaca data dan seberapa sering, lalu menyesuaikan ukuran arsitektur dari sana.
Pendekatan EcoXplore
EcoXplore adalah integrator sistem yang berkantor pusat di Singapura. Praktik PQMS berjalan di atas tiga prinsip:
- Class A atau jangan repot. Meter yang tidak dapat lulus uji kesesuaian IEC 61000-4-30 disaring keluar pada tahap proposal.
- Pelaporan yang mengutamakan standar. Setiap dashboard dikirim dengan laporan yang dikunci ke IEEE 519, EN 50160, dan templat commissioning utilitas setempat, bukan widget grafik generik.
- Integrasi alih-alih penggantian. Stack BMS, EMS, dan SCADA yang ada ditambah, bukan dibongkar. Kecenderungannya mengarah ke protokol terbuka (BACnet, Modbus TCP, OPC UA, MQTT).
Tim ini memegang sertifikasi BCA ME02 Workhead Grade L4, ISO 9001:2015, ISO 14001:2015, dan ISO 45001:2018, dengan penerapan di Singapura, Thailand, Malaysia, Indonesia, dan Vietnam yang mencakup pusat data, rumah sakit, pabrik farmasi, dan gedung pemerintah.
Lini waktu penerapan dan anggaran tipikal
Lingkup PQMS satu lokasi yang representatif (12 hingga 20 meter Class A, terintegrasi SCADA, dengan ekor commissioning enam bulan) berkisar dari dua belas minggu untuk desain dan pengadaan hingga enam sampai sepuluh minggu lagi untuk instalasi, commissioning, dan acceptance. Biaya perangkat keras kira-kira SGD 4,000 hingga SGD 12,000 per titik meter Class A, tergantung ukuran feeder dan kebutuhan aksesori CT. Lingkup perangkat lunak dan integrasi sangat bervariasi sesuai historian yang dipilih. Angka anggaran bersifat indikatif dan sebaiknya dikonfirmasi melalui penawaran spesifik per lokasi.
Pertanyaan yang sering diajukan
Apakah PQMS sama dengan EMS? Tidak. Sebuah Energy Management System melacak konsumsi (kWh, kVA, submetering W.A.G.E.S). Sebuah PQMS melacak kualitas suplai (sag, harmonik, transient). Keduanya berbagi perangkat keras ketika meter revenue menawarkan kedua pengukuran tersebut, tetapi pelaporan dan standarnya berbeda. Lihat halaman perbandingan EMS vs PQMS yang khusus.
Apa lokasi terkecil yang membutuhkan PQMS? Setiap fasilitas di mana satu peristiwa PQ akan mengganggu pendapatan. Itu mencakup pusat data (ukuran berapa pun), fab semikonduktor, cleanroom farmasi, rumah sakit (kamar operasi), dan fasilitas penyiaran. Gedung perkantoran komersial tipikal biasanya tidak membutuhkannya.
Apakah data PQMS terintegrasi dengan BMS? Ya, melalui BACnet/IP atau Modbus TCP untuk titik status dan melalui SQL atau OPC UA untuk catatan peristiwa. Rincian integrasi bergantung pada head-end BMS mana yang digunakan. Lihat halaman Building Management System untuk pola tipikalnya.
Seberapa sering laporan kepatuhan IEEE 519 dipersyaratkan? Sebagian besar utilitas mensyaratkan studi awal pada koneksi jaringan dan studi ulang hanya ketika profil beban berubah secara material. Beberapa pelanggan industri yang lebih besar menjalankan ringkasan triwulanan secara internal bahkan ketika tidak diwajibkan secara kontraktual, untuk menangkap drift.
Kinerja ride-through seperti apa yang harus dispesifikasikan peralatan? Kurva ITIC dan CBEMA adalah acuan yang biasa digunakan masing-masing untuk peralatan IT dan peralatan proses. Masing-masing mendefinisikan envelope tegangan dan durasi yang diharapkan dapat ditoleransi peralatan tanpa gangguan.
Bicara dengan tim teknik EcoXplore
Untuk tinjauan lokasi, proposal anggaran, atau peragaan contoh dashboard, hubungi tim EcoXplore. Tinjauan lokasi awal untuk Singapura dan Johor biasanya diselesaikan dalam dua minggu.
Hệ thống Giám sát Chất lượng Điện năng (PQMS): Đo lường những gì và mang lại hiệu quả ở đâu
Một lần sụt áp duy nhất trong nhà máy sản xuất bán dẫn có thể làm hỏng cả một lô wafer trị giá vài trăm nghìn đô la. Một sóng hài giảm chấn kém có thể làm gián đoạn một ca chụp MRI giữa chừng. Các thiết bị phát hiện những sự kiện này trước khi chúng gây tốn kém, hoặc sau khi chúng gây tốn kém để lần sau có thể tránh được, là một phần của Hệ thống Giám sát Chất lượng Điện năng (PQMS).
Trang này giải thích PQMS đo lường những gì, các tiêu chuẩn mà nó phải đáp ứng tại Singapore và khu vực Đông Nam Á rộng lớn hơn, kiến trúc thường được triển khai như thế nào, và cách EcoXplore tiếp cận công việc này.
Vì sao chất lượng điện năng quan trọng
Các phụ tải công nghiệp hiện đại nhạy cảm theo những cách mà thông số định mức trên nhãn không thể hiện được. Bộ truyền động tốc độ thay đổi tiêu thụ dòng điện sóng hài. Bộ chỉnh lưu UPS làm biến dạng dạng sóng nguồn. Các thiết bị quang khắc, máy quét MRI và máy stepper bán dẫn có cửa sổ chịu đựng được đo bằng mili giây.
Một lần sụt áp 100 mili giây, hoàn toàn nằm trong giới hạn của EN 50160, có thể làm hỏng một máy stepper và làm hỏng cả một lô wafer. Các chỉ số độ tin cậy IEEE 1366 đếm số lần mất điện; chúng không tính đến tổn thất sản xuất. PQMS là thứ ghi lại sự kiện, phân loại nó theo tiêu chuẩn liên quan, và cho phép kỹ sư cơ sở tái dựng lại điều gì đã gây trục trặc, điều gì đã tồn tại được, và vì sao.
Đối với các chủ sở hữu đang theo đuổi chứng nhận BCA Green Mark, quản lý năng lượng ISO 50001, hoặc các điều khoản công bố năng lượng của cơ chế báo cáo khí hậu Singapore MAS, dữ liệu chất lượng điện năng không phải là thứ có cũng được không có cũng xong. Đo lường phụ và nhật ký PQ là một phần của bộ hồ sơ bằng chứng.
PQMS đo lường những gì
Các hiện tượng được PQMS theo dõi rơi vào một số ít danh mục, mỗi danh mục có một phương pháp đo lường được xác định:
| Hiện tượng | Định nghĩa | Tiêu chuẩn / phương pháp |
|---|---|---|
| Sụt áp (lõm áp) | Điện áp RMS giảm xuống còn 10% đến 90% giá trị danh định trong nửa chu kỳ đến một phút | IEC 61000-4-30 Class A, cửa sổ 10 chu kỳ |
| Tăng áp | Điện áp RMS tăng trên 110% giá trị danh định | IEC 61000-4-30 Class A |
| Quá độ (xung / dao động) | Dao động điện áp dưới một chu kỳ, thường từ đóng cắt hoặc sét | IEEE 1159 |
| Méo sóng hài | Méo tuần hoàn của dạng sóng cơ bản | IEC 61000-4-7, biểu thị dưới dạng THD và giới hạn từng sóng hài theo IEEE 519-2022 |
| Mất cân bằng điện áp | Chênh lệch giữa các điện áp pha | IEC 61000-4-30, thành phần thứ tự nghịch |
| Nhấp nháy | Cảm nhận thị giác về sự điều biến điện áp lặp lại | IEC 61000-4-15 |
| Sóng hài xen kẽ | Các thành phần tần số nằm giữa các sóng hài nguyên | IEC 61000-4-7 Phụ lục A |
Cấp độ của thiết bị có vai trò quan trọng. IEC 61000-4-30 định nghĩa Class A (cấp đo đếm doanh thu và cấp tuân thủ), Class S (khảo sát thống kê và sàng lọc), và Class B (cung cấp thông tin). Đối với báo cáo tuân thủ có tính ràng buộc, Class A là lựa chọn an toàn duy nhất. Class S phù hợp để khảo sát đặc tính hiện trường. Class B là cấp tiêu dùng.
Tiêu chuẩn và tuân thủ tại Đông Nam Á
Các tiêu chuẩn tham chiếu cho công việc PQMS trong khu vực này tập trung quanh ba tài liệu:
IEEE 519-2022 điều chỉnh các giới hạn sóng hài tại điểm ghép nối chung giữa khách hàng và đơn vị cung cấp điện. Bản sửa đổi năm 2022 đã siết chặt các giới hạn TDD (tổng méo nhu cầu) và tái cấu trúc cửa sổ đánh giá. Tại Singapore, việc tuân thủ IEEE 519 được tham chiếu trong các nghiên cứu kết nối lưới EMA cho các phụ tải công nghiệp lớn.
EN 50160 mô tả các đặc tính điện áp mà một mạng lưới công cộng được kỳ vọng cung cấp. Đây là tiêu chuẩn tham chiếu của châu Âu thường được các nhóm phía đơn vị cung cấp điện viện dẫn khi khách hàng cho rằng nguồn cấp không đạt thông số kỹ thuật. Nhiều đơn vị cung cấp điện ở Đông Nam Á, bao gồm SP Group tại Singapore và TNB tại Malaysia, coi EN 50160 là một chuẩn nội bộ ngay cả khi nó chưa được công báo.
IEC 61000-4-30 là tiêu chuẩn phương pháp. Nó quy định cách thiết bị đo phải tổng hợp, gắn dấu thời gian, và báo cáo từng sự kiện. Một thiết bị đo tự nhận là Class A nhưng không triển khai gắn cờ trong các lần sụt áp thì chưa hiểu được tiêu chuẩn. Người mua nên xác minh các tuyên bố Class A bằng cách yêu cầu báo cáo kiểm tra phù hợp IEC 61000-4-30 của nhà sản xuất, không chỉ dựa vào tờ rơi tiếp thị.
Đối với báo cáo BCA tại Singapore, cả Cơ quan Quản lý Thị trường Năng lượng và BCA đều tham chiếu các tài liệu này trong sổ tay của họ. Đạo luật Kiểm soát Xây dựng và bộ tiêu chí Green Mark NRB:2015 mỗi văn bản đều nêu rõ các điều khoản về đo lường phụ và dữ liệu chất lượng năng lượng. Đội ngũ tuân thủ của EcoXplore có thể giúp ánh xạ việc triển khai PQMS của một địa điểm tới các mẫu báo cáo cụ thể cần thiết cho việc nộp hàng năm.
Các phương án kiến trúc
Việc triển khai PQMS rơi vào ba mô hình phổ biến, được lựa chọn dựa trên quy mô địa điểm và mức độ sẵn sàng tích hợp:
PQMS độc lập. Một thiết bị đo Class A chuyên dụng trên mỗi nhánh cấp điện quan trọng, ghi nhật ký cục bộ và được truy xuất qua Modbus TCP vào một gói phân tích do nhà cung cấp cung cấp. Chi phí thấp nhất. Tích hợp thấp nhất. Phù hợp cho các địa điểm thương mại nhỏ hoặc để bổ sung khả năng quan sát PQ cho một khu vực có vấn đề duy nhất.
PQMS tích hợp SCADA. Các thiết bị đo Class A đưa dữ liệu vào bộ lưu trữ lịch sử SCADA hiện có cùng với trạng thái máy cắt, nhiệt độ và các tín hiệu I/O khác. Các sự kiện trở nên tương quan với bối cảnh vận hành (máy cắt nào đã ngắt, phụ tải nào đang trực tuyến). Phù hợp nhất cho các địa điểm công nghiệp đã vận hành nền tảng SCADA.
PQMS tổng hợp trên đám mây. Các thiết bị đo công bố lên nền tảng đám mây (MQTT hoặc API của nhà cung cấp), và các bảng điều khiển được truy cập từ bất cứ đâu. Hữu ích cho các danh mục nhiều địa điểm nơi một kỹ sư phụ trách nhiều vị trí. Cần lưu ý các ràng buộc về chủ quyền dữ liệu ở MY, VN và ID nơi dữ liệu được quản lý phải được giữ trong nước.
Lựa chọn đúng không phải là phương án đắt nhất. Một nhà máy bán dẫn không phải lúc nào cũng cần đám mây. Một nhà bán lẻ nhiều địa điểm hiếm khi cần SCADA. Đánh giá trước triển khai của EcoXplore bắt đầu từ câu hỏi ai đọc dữ liệu và đọc thường xuyên như thế nào, rồi từ đó định cỡ kiến trúc xuống cho phù hợp.
Cách tiếp cận của EcoXplore
EcoXplore là một nhà tích hợp hệ thống đặt trụ sở tại Singapore. Mảng PQMS vận hành trên ba nguyên tắc:
- Class A hoặc không làm. Các thiết bị đo không thể vượt qua kiểm tra phù hợp IEC 61000-4-30 sẽ bị loại khỏi giai đoạn đề xuất.
- Báo cáo lấy tiêu chuẩn làm gốc. Mỗi bảng điều khiển đều đi kèm các báo cáo được gắn với IEEE 519, EN 50160, và mẫu nghiệm thu của đơn vị cung cấp điện địa phương, chứ không phải các tiện ích biểu đồ chung chung.
- Tích hợp thay vì thay thế. Các hệ thống BMS, EMS và SCADA hiện có được tăng cường, chứ không bị tháo dỡ. Thiên hướng là hướng tới các giao thức mở (BACnet, Modbus TCP, OPC UA, MQTT).
Đội ngũ này nắm giữ chứng nhận BCA ME02 Workhead Grade L4, ISO 9001:2015, ISO 14001:2015 và ISO 45001:2018, với các dự án triển khai trải khắp Singapore, Thái Lan, Malaysia, Indonesia và Việt Nam, bao phủ các trung tâm dữ liệu, bệnh viện, nhà máy dược phẩm và tòa nhà chính phủ.
Tiến độ và ngân sách triển khai điển hình
Một phạm vi PQMS đơn địa điểm tiêu biểu (12 đến 20 thiết bị đo Class A, tích hợp SCADA, với giai đoạn nghiệm thu kéo dài sáu tháng) chạy từ mười hai tuần cho thiết kế và mua sắm đến thêm sáu đến mười tuần cho lắp đặt, nghiệm thu và chấp nhận. Chi phí phần cứng vào khoảng SGD 4,000 đến SGD 12,000 cho mỗi điểm đo Class A, tùy thuộc vào kích thước nhánh cấp điện và yêu cầu CT phụ trợ. Phạm vi phần mềm và tích hợp thay đổi rất nhiều theo bộ lưu trữ lịch sử được chọn. Các con số dự toán chỉ mang tính tham khảo và cần được xác nhận bằng một báo giá riêng cho từng địa điểm cụ thể.
Câu hỏi thường gặp
PQMS có giống EMS không? Không. Một Hệ thống Quản lý Năng lượng theo dõi mức tiêu thụ (kWh, kVA, đo lường phụ W.A.G.E.S). Một PQMS theo dõi chất lượng của nguồn cấp (sụt áp, sóng hài, quá độ). Cả hai chia sẻ phần cứng nơi các thiết bị đo doanh thu cung cấp cả hai phép đo, nhưng việc báo cáo và các tiêu chuẩn thì khác nhau. Xem trang so sánh EMS với PQMS chuyên biệt.
Địa điểm nhỏ nhất nào cần PQMS? Bất kỳ cơ sở nào mà một sự kiện PQ duy nhất sẽ làm gián đoạn doanh thu. Điều đó bao gồm các trung tâm dữ liệu (bất kể quy mô), nhà máy sản xuất bán dẫn, phòng sạch dược phẩm, bệnh viện (phòng mổ), và các cơ sở phát sóng. Một tòa nhà văn phòng thương mại điển hình thường không cần đến.
Dữ liệu PQMS có tích hợp với BMS không? Có, thông qua BACnet/IP hoặc Modbus TCP cho các điểm trạng thái và qua SQL hoặc OPC UA cho các bản ghi sự kiện. Chi tiết của việc tích hợp phụ thuộc vào đầu cuối BMS nào đang được sử dụng. Xem trang Hệ thống Quản lý Tòa nhà để biết các mô hình điển hình.
Báo cáo tuân thủ IEEE 519 cần thực hiện thường xuyên như thế nào? Hầu hết các đơn vị cung cấp điện yêu cầu một nghiên cứu ban đầu khi kết nối lưới và chỉ nghiên cứu lại khi biên dạng phụ tải thay đổi đáng kể. Một số khách hàng công nghiệp lớn hơn chạy các bản tóm tắt hàng quý trong nội bộ ngay cả khi không bắt buộc theo hợp đồng, để phát hiện sự trôi dạt.
Thiết bị nên đặc tả hiệu năng chịu đựng như thế nào? Các đường cong ITIC và CBEMA là những tham chiếu thông thường lần lượt cho thiết bị CNTT và thiết bị quy trình. Mỗi đường cong xác định một bao hình về điện áp và thời lượng mà thiết bị được kỳ vọng chịu đựng được mà không bị nhiễu loạn.
Trao đổi với đội ngũ kỹ thuật của EcoXplore
Để được đánh giá địa điểm, đề xuất ngân sách, hoặc hướng dẫn tham quan bảng điều khiển mẫu, hãy liên hệ đội ngũ EcoXplore. Các đợt đánh giá địa điểm ban đầu cho Singapore và Johor thường được hoàn thành trong vòng hai tuần.
More About Ecoxplore
We are dedicated to empowering businesses with software and services that drive efficiency and growth
View more

.svg)

.svg)

.svg)
.svg)

More About Ecoxplore
We are dedicated to empowering businesses with software and services that drive efficiency and growth
View moreข้อมูลเพิ่มเติมเกี่ยวกับ Ecoxplore
เรามุ่งมั่นในการช่วยให้ธุรกิจของคุณทำงานได้อย่างมีประสิทธิภาพและเติบโตอย่างยั่งยืนด้วยซอฟต์แวร์และบริการของเรา
ดูเพิ่มเติมMore About Ecoxplore
We are dedicated to empowering businesses with software and services that drive efficiency and growth
View moreLebih Banyak Tentang Ecoxplore
Kami berdedikasi untuk memberdayakan bisnis dengan perangkat lunak dan layanan yang mendorong efisiensi dan pertumbuhan
Lihat lebih banyakMore About Ecoxplore
We are dedicated to empowering businesses with software and services that drive efficiency and growth
View moreLebih Banyak Tentang Ecoxplore
Kami berdedikasi untuk memberdayakan bisnis melalui perangkat lunak dan layanan yang mendorong efisiensi serta pertumbuhan.
Lihat selengkapnyaMore About Ecoxplore
We are dedicated to empowering businesses with software and services that drive efficiency and growth
View moreHiểu thêm về Ecoxplore
Chúng tôi cam kết trao quyền cho các doanh nghiệp bằng phần mềm và dịch vụ giúp tăng cường hiệu quả và phát triển
Xem thêm