


.svg)







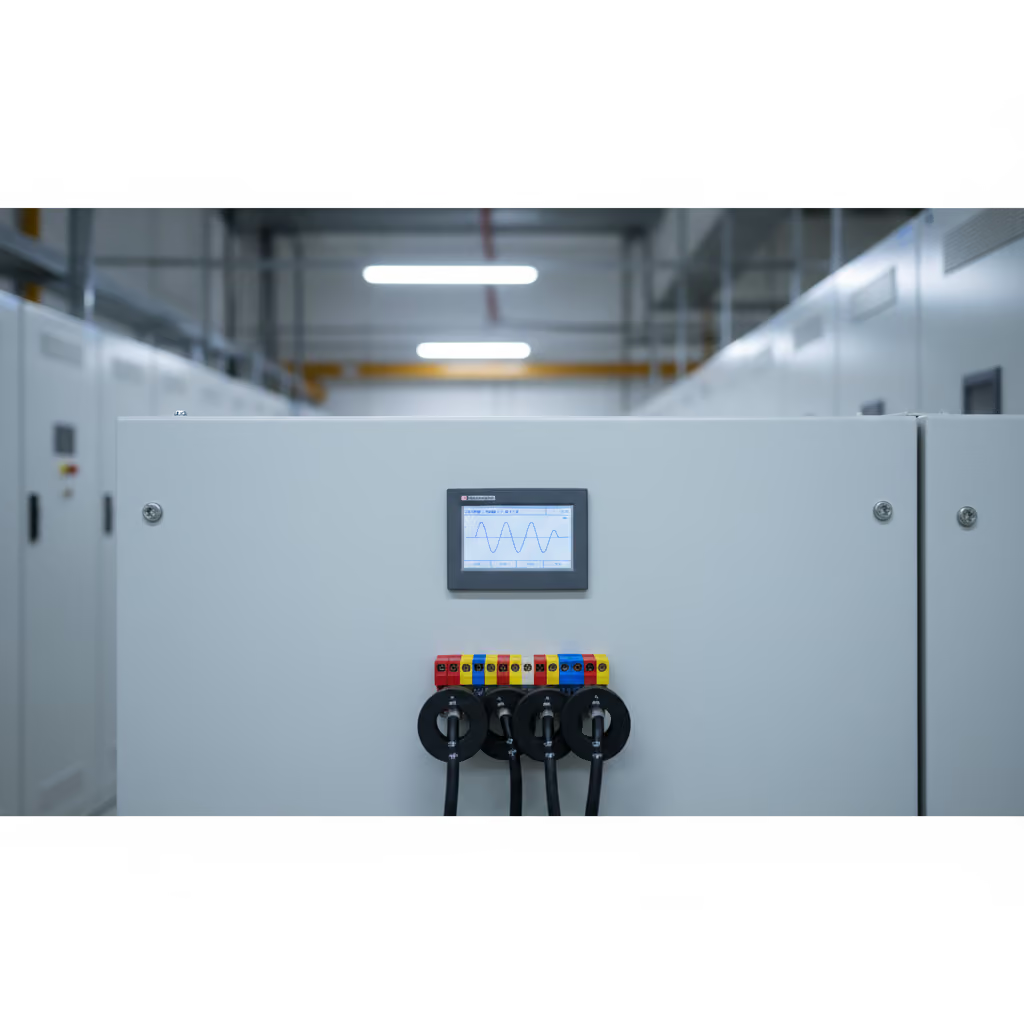
EMS vs PQMS — What Each Monitors and When You Need Both
Prospects routinely ask EcoXplore's engineering team whether an Energy Management System (EMS) and a Power Quality Monitoring System (PQMS) are the same thing, whether one replaces the other, and whether they can share hardware. The short answer: they overlap at the meter, diverge at every layer above it, and most large sites end up needing both.
TL;DR comparison
| Aspect | EMS | PQMS |
|---|---|---|
| Primary question | How much energy is consumed, where, and by what? | What is the quality of the supply, and when does it disturb operations? |
| Headline units | kWh, kVA, m³, Sm³ (W.A.G.E.S) | RMS sag/swell, % THD, transient peak voltage, flicker Pst/Plt |
| Scan rate | 1 second to 15 minutes | Sub-cycle to milliseconds (event-driven) |
| Reference standards | ISO 50001, IEC 62053-22 (Class 0.5S meters) | IEEE 519-2022, IEC 61000-4-30, EN 50160 |
| Typical reports | Monthly consumption, ESG Scope 2, BCA Green Mark | Event logs, IEEE 519 compliance summary, utility correspondence |
| Output to operations | Budget, anomaly alerts, ESG disclosure | Forensic event records, ride-through specification, utility dispute evidence |
| Without it, you lose | Visibility on cost and emissions | Visibility on why critical loads tripped |
If a facility cares mostly about cost, emissions, or certification, EMS is the system. If it cares mostly about uptime of sensitive equipment, PQMS is the system. The cases where it cares about both are common enough that integrated deployments are EcoXplore's default for industrial and mission-critical sites.
What an EMS measures
EMS instruments the consumption side. The phenomena it tracks:
- Active energy (kWh) at the main intake and downstream distribution boards.
- Demand (kVA, kW) in 15-minute or 30-minute intervals matching utility billing windows.
- Power factor for tariff compliance.
- W.A.G.E.S submeters — water, air, gas, electricity, steam — at the level needed to attribute consumption to processes, tenants, or assets.
The data lives in a historian, normalised against driver variables (production volume, cooling degree days, occupancy), and surfaces as KPIs, monthly summaries, and ISO 50001 management-review packs.
Sample rate is slow because consumption trends move slowly. A 15-minute interval misses nothing on the consumption story.
What a PQMS measures
PQMS instruments the supply side. Phenomena tracked per IEC 61000-4-30:
- Voltage sags and swells (10-cycle RMS, Class A aggregation).
- Harmonics to the 50th order per IEC 61000-4-7, with TDD scored against IEEE 519-2022.
- Transients — impulsive (lightning, switching) and oscillatory (capacitor switching).
- Voltage unbalance by symmetrical components.
- Flicker (Pst, Plt) for sites with welders, arc furnaces, or large variable loads.
- Interharmonics, increasingly relevant where inverter-coupled loads dominate.
Sample rate is fast because PQ events are short. A meter that aggregates to 15-minute averages will miss every sag and every transient that matters. Class A meters per IEC 61000-4-30 are the only meters that can defensibly report on PQ events.
The overlap zone
EMS and PQMS overlap at exactly two layers:
1. Revenue-grade meters. Many modern meters (Schneider PowerLogic ION9000, Janitza UMG 605, Siemens Sentron PAC4200) can simultaneously serve as Class 0.5S revenue meters and Class A PQ analysers. One device, two reports.
2. Current transformers (CTs) and voltage transformers (VTs). The same instrument transformers feed both systems. Saving on CTs is the single biggest cost lever in integrated deployments.
Above the meter the systems diverge. EMS rolls minute-level data into a historian and produces monthly reports. PQMS captures sub-cycle events and produces forensic records. Mixing the two report streams confuses readers; keep the historians separate even when the meter is shared.
When EMS only is enough
A typical commercial office building (single tenant, BCA Green Mark Platinum target, no critical IT load) needs an EMS. It does not need PQMS because:
- No load on site has ride-through sensitivity that justifies forensic-grade event capture.
- Utility supply quality in Singapore is high enough that residual PQ exposure is acceptable.
- Reporting obligations (BCA Green Mark, MAS Scope 2) are all consumption-side.
For these sites EcoXplore deploys EMS only. Adding PQMS would inflate cost without changing any decision.
When PQMS only is enough
A semiconductor fab with stable, well-budgeted consumption but high downtime cost from PQ events needs PQMS more than EMS. The fab knows its kWh trend; it cannot predict the next 100-ms sag that scraps a wafer batch.
For these sites EcoXplore deploys PQMS with optional submeter integration if the facility wants to layer consumption tracking later.
When you need both
Sites that need both:
- Data centres — Tier III/IV obligations include both PUE (consumption metric) and PQ event logging for IT-load forensics.
- Hospitals — operating theatres and MRI suites need PQ event capture; the rest of the hospital needs energy reporting for sustainability disclosures.
- Pharmaceutical plants — GMP requirements include both energy traceability and excursion records.
- Multi-tenant industrial parks — tenant submetering (EMS) sits alongside common-bus PQ monitoring (PQMS).
EcoXplore's standard approach for these sites: shared revenue-grade meters at distribution boards, dedicated Class A PQ meters at the critical busbars, and two separate historians joined by tagging conventions.
A concrete example
A regional hospital group EcoXplore deployed for in Johor in 2024 ran 36 measurement points across two buildings. Twenty-two were Schneider ION9000 units serving both EMS and PQMS functions (block A main intakes, theatre-bus feeders, MRI feeders, chiller plant). Fourteen were lower-cost Class 0.5S submeters at tenant boards where PQ data was not required. The integrated deployment cut CT and panel-build cost by approximately 30% compared with a parallel deployment, while preserving Class A reporting on the feeders that mattered.
The reports diverge cleanly: ISO 50001 monthly review pulls from the EMS historian; PQ event correlation against theatre downtime pulls from the PQMS historian; the two reference the same meter tags so an event-time consumption profile can be reconstructed in either tool.
Frequently asked questions
Can a single meter replace both systems? A revenue-grade Class A meter can capture the data both systems need. The systems above the meter (historian, dashboards, reports) are still separate because the report templates and standards differ.
Is PQMS just a fancier EMS? No. EMS is consumption-side at slow scan rates; PQMS is supply-side at sub-cycle resolution. Different instruments, different historians, different reports.
Which should be deployed first? EMS first for most sites — it pays back faster in tariff and ESG terms. Add PQMS when a recorded PQ event has cost real money, or when a sensitive load is being installed.
Does ISO 50001 require PQ data? No. ISO 50001 is an energy-management standard. PQ data is relevant when poor quality is degrading equipment efficiency, but it is not a primary input.
Talk to EcoXplore
For sites considering EMS, PQMS, or an integrated deployment, EcoXplore's engineering team offers site reviews and budgetary proposals. See the PQMS page, the EMS page, or contact us directly.



EMS 与 PQMS 对比:各自监测什么,以及何时两者都需要
客户经常向 EcoXplore 的工程团队询问:能源管理系统(EMS)与电能质量监测系统(PQMS)是否是同一回事,是否可以互相替代,以及它们能否共用硬件。简短的回答是:它们在计量表处重叠,在其上的每一层逐渐分离,而大多数大型场所最终两者都需要。
快速对比
| 方面 | EMS | PQMS |
|---|---|---|
| 核心问题 | 消耗了多少能源,在哪里,由什么消耗? | 供电质量如何,何时会干扰运营? |
| 主要单位 | kWh、kVA、m³、Sm³(W.A.G.E.S) | RMS 电压暂降/暂升、% THD、暂态峰值电压、闪变 Pst/Plt |
| 采样速率 | 1 秒至 15 分钟 | 亚周波至毫秒级(事件驱动) |
| 参考标准 | ISO 50001、IEC 62053-22(Class 0.5S 计量表) | IEEE 519-2022、IEC 61000-4-30、EN 50160 |
| 典型报告 | 月度能耗、ESG Scope 2、BCA Green Mark | 事件日志、IEEE 519 合规摘要、与供电公司的往来记录 |
| 面向运营的输出 | 预算、异常告警、ESG 披露 | 取证级事件记录、穿越能力规格、供电纠纷证据 |
| 缺少它,你会失去 | 对成本和排放的可见性 | 对关键负载为何跳闸的可见性 |
如果一个设施主要关注成本、排放或认证,那么 EMS 就是合适的系统。如果它主要关注敏感设备的正常运行时间,那么 PQMS 就是合适的系统。两者都关注的情况相当普遍,因此对于工业和关键任务场所,集成部署是 EcoXplore 的默认方案。
EMS 监测什么
EMS 对消耗侧进行测量。它跟踪的现象包括:
- 主进线及下游配电柜处的有功电能(kWh)。
- 以 15 分钟或 30 分钟为间隔、与供电计费窗口匹配的需量(kVA、kW)。
- 用于电价合规的功率因数。
- W.A.G.E.S 分项计量(水、压缩空气、燃气、电、蒸汽),细化到足以将能耗归因于工艺、租户或资产的层级。
这些数据存储于历史数据库中,依据驱动变量(产量、制冷度日、入住率)进行归一化处理,并以 KPI、月度摘要和 ISO 50001 管理评审资料的形式呈现。
采样速率较慢,因为能耗趋势变化缓慢。15 分钟的间隔不会遗漏能耗故事中的任何内容。
PQMS 监测什么
PQMS 对供电侧进行测量。依据 IEC 61000-4-30 跟踪的现象包括:
- 电压暂降与暂升(10 周波 RMS,A 类聚合)。
- 依据 IEC 61000-4-7 测至 50 次的谐波,并以 TDD 对照 IEEE 519-2022 评分。
- 暂态:冲击型(雷击、开关操作)和振荡型(电容器投切)。
- 按对称分量计算的电压不平衡。
- 针对配有焊机、电弧炉或大型变动负载场所的闪变(Pst、Plt)。
- 间谐波,在逆变器耦合负载占主导的场所日益重要。
采样速率较快,因为 PQ 事件十分短暂。一台聚合为 15 分钟平均值的计量表会遗漏每一次重要的暂降和每一次重要的暂态。依据 IEC 61000-4-30 的 A 类计量表是唯一能够确凿地报告 PQ 事件的计量表。
重叠区域
EMS 与 PQMS 恰好在两个层面重叠:
1. 计费级计量表。许多现代计量表(Schneider PowerLogic ION9000、Janitza UMG 605、Siemens Sentron PAC4200)可同时充当 0.5S 级计费计量表和 A 类 PQ 分析仪。一台设备,两份报告。
2. 电流互感器(CT)与电压互感器(VT)。同一组仪用互感器为两套系统供电。在 CT 上节省成本是集成部署中最大的单项成本杠杆。
在计量表之上,两套系统逐渐分离。EMS 将分钟级数据汇入历史数据库并生成月度报告。PQMS 捕获亚周波事件并生成取证记录。将两种报告流混在一起会让读者困惑;即使共用计量表,也应将历史数据库分开。
何时仅 EMS 就足够
一栋典型的商业办公楼(单一租户、以 BCA Green Mark 铂金级为目标、无关键 IT 负载)需要 EMS。它不需要 PQMS,因为:
- 现场没有任何负载具备足以证明取证级事件捕获合理性的穿越敏感性。
- 新加坡的供电质量足够高,残余的 PQ 暴露风险是可接受的。
- 报告义务(BCA Green Mark、MAS Scope 2)都属于消耗侧。
对于这类场所,EcoXplore 仅部署 EMS。增加 PQMS 只会抬高成本,却不会改变任何决策。
何时仅 PQMS 就足够
一家能耗稳定、预算充分但因 PQ 事件而停机成本高昂的半导体晶圆厂,对 PQMS 的需求大于对 EMS 的需求。晶圆厂知道自己的 kWh 趋势;它无法预测下一次会报废一批晶圆的 100 毫秒暂降。
对于这类场所,EcoXplore 部署 PQMS,并在设施希望日后叠加能耗跟踪时提供可选的分项计量集成。
何时两者都需要
两者都需要的场所:
- 数据中心:Tier III/IV 义务既包括 PUE(消耗指标),也包括用于 IT 负载取证的 PQ 事件记录。
- 医院:手术室和 MRI 套间需要 PQ 事件捕获;医院其余部分需要用于可持续披露的能源报告。
- 制药厂:GMP 要求既包括能源可追溯性,也包括偏差记录。
- 多租户工业园区:租户分项计量(EMS)与公共母线 PQ 监测(PQMS)并存。
EcoXplore 针对这类场所的标准做法是:在配电柜处共用计费级计量表,在关键母线处设置专用的 A 类 PQ 计量表,并通过标签约定关联两个独立的历史数据库。
一个具体案例
EcoXplore 于 2024 年为新山一家区域性医院集团部署的项目,在两栋楼宇中运行 36 个测量点。其中 22 个为 Schneider ION9000 单元,同时承担 EMS 和 PQMS 功能(A 栋主进线、手术室母线馈线、MRI 馈线、冷水机房)。另外 14 个为成本较低的 0.5S 级分项计量表,安装在不需要 PQ 数据的租户配电柜处。与并行部署相比,这一集成部署将 CT 和配电柜组装成本降低了约 30%,同时在重要的馈线上保留了 A 类报告能力。
报告划分清晰:ISO 50001 月度评审从 EMS 历史数据库提取数据;PQ 事件与手术室停机的关联分析从 PQMS 历史数据库提取数据;两者引用相同的计量表标签,因此可在任一工具中重建事件发生时的能耗曲线。
常见问题
单台计量表能否替代两套系统?一台计费级 A 类计量表可以捕获两套系统所需的数据。但计量表之上的系统(历史数据库、仪表盘、报告)仍然是分开的,因为报告模板和标准各不相同。
PQMS 只是更高级的 EMS 吗?不是。EMS 是消耗侧、采样速率较慢;PQMS 是供电侧、分辨率达亚周波级。不同的仪表,不同的历史数据库,不同的报告。
应该先部署哪一个?对大多数场所而言先部署 EMS,因为它在电价和 ESG 方面回本更快。当一次有记录的 PQ 事件造成了真金白银的损失时,或当要安装敏感负载时,再增加 PQMS。
ISO 50001 是否要求 PQ 数据?不要求。ISO 50001 是一项能源管理标准。当质量低劣正在降低设备效率时,PQ 数据是有意义的,但它并非主要输入。
联系 EcoXplore
对于正在考虑 EMS、PQMS 或集成部署的场所,EcoXplore 的工程团队提供现场评估和预算方案。请参阅 PQMS 页面、EMS 页面,或直接联系我们。
EMS เทียบกับ PQMS: แต่ละระบบตรวจวัดอะไร และเมื่อใดที่คุณต้องใช้ทั้งสองระบบ
ผู้สนใจมักสอบถามทีมวิศวกรรมของ EcoXplore อยู่เสมอว่าระบบบริหารจัดการพลังงาน (EMS) และระบบตรวจวัดคุณภาพไฟฟ้า (PQMS) เป็นสิ่งเดียวกันหรือไม่ ระบบหนึ่งใช้แทนอีกระบบหนึ่งได้หรือไม่ และทั้งสองระบบใชฺ้ฮาร์ดแวร์ร่วมกันได้หรือไม่ คำตอบสั้นๆ คือ ทั้งสองระบบทับซ้อนกันที่จุดมิเตอร์ แยกออกจากกันในทุกชั้นที่สูงขึ้นไป และสถานที่ขนาดใหญ่ส่วนใหญ่ลงเอยด้วยการต้องใช้ทั้งสองระบบ
สรุปการเปรียบเทียบโดยย่อ
| ประเด็น | EMS | PQMS |
|---|---|---|
| คำถามหลัก | ใช้พลังงานไปเท่าใด ที่ไหน และโดยอะไร? | คุณภาพของแหล่งจ่ายไฟเป็นอย่างไร และเมื่อใดที่มันรบกวนการดำเนินงาน? |
| หน่วยวัดหลัก | kWh, kVA, m³, Sm³ (W.A.G.E.S) | RMS sag/swell, % THD, แรงดันพีคชั่วครู่ (transient), การกะพริบ Pst/Plt |
| อัตราการสแกน | 1 วินาที ถึง 15 นาที | ต่ำกว่าหนึ่งรอบคลื่นถึงระดับมิลลิวินาที (ขับเคลื่อนด้วยเหตุการณ์) |
| มาตรฐานอ้างอิง | ISO 50001, IEC 62053-22 (มิเตอร์ Class 0.5S) | IEEE 519-2022, IEC 61000-4-30, EN 50160 |
| รายงานทั่วไป | การใช้พลังงานรายเดือน, ESG Scope 2, BCA Green Mark | บันทึกเหตุการณ์, สรุปการปฏิบัติตาม IEEE 519, การติดต่อกับการไฟฟ้า |
| ผลลัพธ์ที่ส่งต่อสู่การดำเนินงาน | งบประมาณ, การแจ้งเตือนความผิดปกติ, การเปิดเผยข้อมูล ESG | บันทึกเหตุการณ์เชิงนิติวิทยา, ข้อกำหนด ride-through, หลักฐานข้อพิพาทกับการไฟฟ้า |
| หากไม่มีระบบนี้ คุณจะสูญเสีย | การมองเห็นต้นทุนและการปล่อยก๊าซเรือนกระจก | การมองเห็นว่าเหตุใดโหลดวิกฤตจึงทริป |
หากสถานที่ใดให้ความสำคัญกับต้นทุน การปล่อยก๊าซ หรือการรับรองมาตรฐานเป็นหลัก EMS คือระบบที่ใช่ หากให้ความสำคัญกับความต่อเนื่องในการทำงานของอุปกรณ์ที่ละเอียดอ่อนเป็นหลัก PQMS คือระบบที่ใช่ กรณีที่ให้ความสำคัญทั้งสองด้านนั้นพบได้บ่อยมากพอที่การติดตั้งแบบบูรณาการจะเป็นค่าเริ่มต้นของ EcoXplore สำหรับโรงงานอุตสาหกรรมและสถานที่ที่มีภารกิจสำคัญ
EMS ตรวจวัดอะไร
EMS ติดตั้งเครื่องมือวัดในฝั่งการใช้พลังงาน ปรากฏการณ์ที่ติดตาม ได้แก่:
- พลังงานแอ็กทีฟ (kWh) ที่จุดรับไฟหลักและแผงจ่ายไฟปลายทาง
- ความต้องการกำลังไฟฟ้า (kVA, kW) ในช่วงเวลา 15 นาที หรือ 30 นาที ให้ตรงกับช่วงการคิดค่าไฟของการไฟฟ้า
- ตัวประกอบกำลังไฟฟ้า (Power factor) เพื่อการปฏิบัติตามอัตราค่าไฟ
- มิเตอร์ย่อย W.A.G.E.S ได้แก่ น้ำ อากาศ ก๊าซ ไฟฟ้า และไอน้ำ ในระดับที่จำเป็นต่อการระบุการใช้พลังงานไปยังกระบวนการ ผู้เช่า หรือสินทรัพย์
ข้อมูลถูกจัดเก็บไว้ในฐานข้อมูลประวัติ (historian) ทำการนอร์มัลไลซ์เทียบกับตัวแปรขับเคลื่อน (ปริมาณการผลิต องศาวันทำความเย็น อัตราการเข้าใช้พื้นที่) และแสดงผลออกมาเป็น KPI สรุปรายเดือน และชุดเอกสารทบทวนการจัดการตาม ISO 50001
อัตราการเก็บตัวอย่างช้าเพราะแนวโน้มการใช้พลังงานเปลี่ยนแปลงอย่างช้าๆ ช่วงเวลา 15 นาทีไม่พลาดสิ่งใดในเรื่องราวของการใช้พลังงาน
PQMS ตรวจวัดอะไร
PQMS ติดตั้งเครื่องมือวัดในฝั่งแหล่งจ่ายไฟ ปรากฏการณ์ที่ติดตามตาม IEC 61000-4-30 ได้แก่:
- แรงดันตก (sag) และแรงดันเกินชั่วครู่ (swell) (RMS แบบ 10 รอบคลื่น, การรวมข้อมูลแบบ Class A)
- ฮาร์มอนิก (Harmonics) ถึงลำดับที่ 50 ตาม IEC 61000-4-7 โดยให้คะแนน TDD เทียบกับ IEEE 519-2022
- แรงดันชั่วครู่ (Transients) ทั้งแบบอิมพัลส์ (ฟ้าผ่า การสวิตชิง) และแบบแกว่ง (การสวิตชิงตัวเก็บประจุ)
- แรงดันไม่สมดุล (Voltage unbalance) วัดด้วยองค์ประกอบสมมาตร
- การกะพริบ (Flicker) (Pst, Plt) สำหรับสถานที่ที่มีเครื่องเชื่อม เตาอาร์ก หรือโหลดแปรผันขนาดใหญ่
- อินเตอร์ฮาร์มอนิก (Interharmonics) ซึ่งมีความเกี่ยวข้องมากขึ้นเรื่อยๆ ในที่ที่โหลดเชื่อมต่อผ่านอินเวอร์เตอร์เป็นส่วนใหญ่
อัตราการเก็บตัวอย่างเร็วเพราะเหตุการณ์ PQ นั้นสั้น มิเตอร์ที่รวมข้อมูลเป็นค่าเฉลี่ย 15 นาทีจะพลาดทุกแรงดันตกและทุกแรงดันชั่วครู่ที่สำคัญ มิเตอร์ Class A ตาม IEC 61000-4-30 เป็นมิเตอร์เพียงชนิดเดียวที่สามารถรายงานเหตุการณ์ PQ ได้อย่างน่าเชื่อถือ
โซนทับซ้อน
EMS และ PQMS ทับซ้อนกันในสองชั้นพอดี:
1. มิเตอร์เกรดเชิงพาณิชย์ (Revenue-grade meters) มิเตอร์สมัยใหม่จำนวนมาก (Schneider PowerLogic ION9000, Janitza UMG 605, Siemens Sentron PAC4200) สามารถทำหน้าที่เป็นทั้งมิเตอร์เชิงพาณิชย์ Class 0.5S และเครื่องวิเคราะห์ PQ แบบ Class A ได้พร้อมกัน หนึ่งอุปกรณ์ สองรายงาน
2. หม้อแปลงกระแส (CTs) และหม้อแปลงแรงดัน (VTs) หม้อแปลงเครื่องมือวัดชุดเดียวกันป้อนข้อมูลให้ทั้งสองระบบ การประหยัดค่า CT คือปัจจัยลดต้นทุนที่ใหญ่ที่สุดเพียงปัจจัยเดียวในการติดตั้งแบบบูรณาการ
เหนือจุดมิเตอร์ขึ้นไป ทั้งสองระบบแยกออกจากกัน EMS รวบรวมข้อมูลระดับนาทีเข้าสู่ฐานข้อมูลประวัติและสร้างรายงานรายเดือน ส่วน PQMS จับเหตุการณ์ที่ต่ำกว่าหนึ่งรอบคลื่นและสร้างบันทึกเชิงนิติวิทยา การนำสายข้อมูลรายงานทั้งสองมาปะปนกันทำให้ผู้อ่านสับสน จึงควรแยกฐานข้อมูลประวัติออกจากกันแม้จะใช้มิเตอร์ร่วมกันก็ตาม
เมื่อใดที่ใช้เพียง EMS ก็เพียงพอ
อาคารสำนักงานเชิงพาณิชย์ทั่วไป (ผู้เช่ารายเดียว เป้าหมาย BCA Green Mark Platinum ไม่มีโหลด IT วิกฤต) จำเป็นต้องใช้ EMS โดยไม่จำเป็นต้องใช้ PQMS เพราะ:
- ไม่มีโหลดใดในสถานที่ที่มีความไวต่อ ride-through จนสมควรต้องจับเหตุการณ์ในระดับเชิงนิติวิทยา
- คุณภาพแหล่งจ่ายไฟของการไฟฟ้าในสิงคโปร์สูงพอที่ความเสี่ยง PQ ที่เหลืออยู่จะยอมรับได้
- ภาระผูกพันด้านการรายงาน (BCA Green Mark, MAS Scope 2) ล้วนเป็นเรื่องฝั่งการใช้พลังงานทั้งสิ้น
สำหรับสถานที่เหล่านี้ EcoXplore ติดตั้งเฉพาะ EMS การเพิ่ม PQMS จะทำให้ต้นทุนพองตัวขึ้นโดยไม่เปลี่ยนแปลงการตัดสินใจใดๆ
เมื่อใดที่ใช้เพียง PQMS ก็เพียงพอ
โรงงานผลิตเซมิคอนดักเตอร์ที่มีการใช้พลังงานคงที่และวางงบประมาณไว้อย่างดี แต่มีต้นทุนความเสียหายจากการหยุดทำงานเนื่องจากเหตุการณ์ PQ สูง จำเป็นต้องใช้ PQMS มากกว่า EMS โรงงานทราบแนวโน้ม kWh ของตนดีอยู่แล้ว แต่ไม่สามารถคาดการณ์แรงดันตก 100 มิลลิวินาทีครั้งถัดไปที่จะทำให้เวเฟอร์ทั้งล็อตเสียหายได้
สำหรับสถานที่เหล่านี้ EcoXplore ติดตั้ง PQMS พร้อมตัวเลือกการบูรณาการมิเตอร์ย่อยหากสถานที่ต้องการเพิ่มการติดตามการใช้พลังงานในภายหลัง
เมื่อใดที่คุณต้องใช้ทั้งสองระบบ
สถานที่ที่จำเป็นต้องใช้ทั้งสองระบบ:
- ศูนย์ข้อมูล (Data centres) ภาระผูกพันระดับ Tier III/IV รวมถึงทั้ง PUE (ตัวชี้วัดการใช้พลังงาน) และการบันทึกเหตุการณ์ PQ เพื่อการสืบสวนโหลด IT
- โรงพยาบาล ห้องผ่าตัดและห้อง MRI ต้องการการจับเหตุการณ์ PQ ส่วนพื้นที่อื่นๆ ของโรงพยาบาลต้องการการรายงานพลังงานเพื่อการเปิดเผยข้อมูลด้านความยั่งยืน
- โรงงานผลิตยา ข้อกำหนด GMP รวมถึงทั้งการตรวจสอบย้อนกลับพลังงานและบันทึกการเบี่ยงเบน
- นิคมอุตสาหกรรมแบบหลายผู้เช่า การวัดมิเตอร์ย่อยของผู้เช่า (EMS) อยู่ควบคู่ไปกับการตรวจวัด PQ ของบัสร่วม (PQMS)
แนวทางมาตรฐานของ EcoXplore สำหรับสถานที่เหล่านี้คือ ใช้มิเตอร์เกรดเชิงพาณิชย์ร่วมกันที่แผงจ่ายไฟ มิเตอร์ PQ แบบ Class A เฉพาะที่บัสบาร์วิกฤต และฐานข้อมูลประวัติสองชุดที่แยกกันแต่เชื่อมโยงกันด้วยข้อตกลงการกำหนดแท็ก
ตัวอย่างที่เป็นรูปธรรม
กลุ่มโรงพยาบาลระดับภูมิภาคที่ EcoXplore ติดตั้งให้ในเมืองยะโฮร์เมื่อปี 2024 มีจุดวัด 36 จุด กระจายอยู่ในอาคารสองหลัง จำนวน 22 จุดเป็นเครื่อง Schneider ION9000 ที่ทำหน้าทั้ง EMS และ PQMS (จุดรับไฟหลักของอาคาร A สายป้อนบัสห้องผ่าตัด สายป้อน MRI โรงทำความเย็น) อีก 14 จุดเป็นมิเตอร์ย่อย Class 0.5S ราคาประหยัดกว่าที่แผงของผู้เช่าซึ่งไม่จำเป็นต้องใช้ข้อมูล PQ การติดตั้งแบบบูรณาการช่วยลดต้นทุน CT และการสร้างแผงลงประมาณ 30% เมื่อเทียบกับการติดตั้งแบบขนาน ในขณะที่ยังคงรักษาการรายงานแบบ Class A ไว้ที่สายป้อนที่สำคัญ
รายงานแยกออกจากกันอย่างชัดเจน: การทบทวนรายเดือนตาม ISO 50001 ดึงข้อมูลจากฐานข้อมูลประวัติของ EMS การเชื่อมโยงเหตุการณ์ PQ กับการหยุดทำงานของห้องผ่าตัดดึงข้อมูลจากฐานข้อมูลประวัติของ PQMS ทั้งสองอ้างอิงแท็กมิเตอร์ชุดเดียวกัน จึงสามารถสร้างโปรไฟล์การใช้พลังงาน ณ เวลาที่เกิดเหตุการณ์ขึ้นใหม่ในเครื่องมือใดเครื่องมือหนึ่งได้
คำถามที่พบบ่อย
มิเตอร์เพียงตัวเดียวสามารถใช้แทนทั้งสองระบบได้หรือไม่? มิเตอร์เกรดเชิงพาณิชย์แบบ Class A สามารถจับข้อมูลที่ทั้งสองระบบต้องการได้ แต่ระบบที่อยู่เหนือมิเตอร์ขึ้นไป (ฐานข้อมูลประวัติ แดชบอร์ด รายงาน) ยังคงแยกจากกันเพราะเทมเพลตรายงานและมาตรฐานแตกต่างกัน
PQMS เป็นเพียง EMS รุ่นหรูใช่หรือไม่? ไม่ใช่ EMS อยู่ฝั่งการใช้พลังงานที่อัตราการสแกนช้า ส่วน PQMS อยู่ฝั่งแหล่งจ่ายไฟที่ความละเอียดระดับต่ำกว่าหนึ่งรอบคลื่น คนละเครื่องมือ คนละฐานข้อมูลประวัติ คนละรายงาน
ควรติดตั้งระบบใดก่อน? EMS ก่อนสำหรับสถานที่ส่วนใหญ่ เพราะคืนทุนได้เร็วกว่าในแง่ของอัตราค่าไฟและ ESG เพิ่ม PQMS เมื่อเหตุการณ์ PQ ที่ถูกบันทึกไว้สร้างความเสียหายเป็นเงินจริง หรือเมื่อมีการติดตั้งโหลดที่ละเอียดอ่อน
ISO 50001 กำหนดให้ต้องมีข้อมูล PQ หรือไม่? ไม่ ISO 50001 เป็นมาตรฐานการจัดการพลังงาน ข้อมูล PQ มีความเกี่ยวข้องเมื่อคุณภาพที่ไม่ดีกำลังบั่นทอนประสิทธิภาพของอุปกรณ์ แต่ไม่ใช่ข้อมูลนำเข้าหลัก
ปรึกษากับ EcoXplore
สำหรับสถานที่ที่กำลังพิจารณา EMS, PQMS หรือการติดตั้งแบบบูรณาการ ทีมวิศวกรรมของ EcoXplore ให้บริการตรวจสอบสถานที่และข้อเสนอด้านงบประมาณ ดูได้ที่ หน้า PQMS, หน้า EMS หรือ ติดต่อเราโดยตรง
EMS vs PQMS: Apa yang Dipantau Masing-Masing dan Kapan Anda Membutuhkan Keduanya
Calon pelanggan rutin bertanya kepada tim teknik EcoXplore apakah Energy Management System (EMS) dan Power Quality Monitoring System (PQMS) merupakan hal yang sama, apakah yang satu menggantikan yang lain, dan apakah keduanya dapat berbagi perangkat keras. Jawaban singkatnya: keduanya tumpang tindih di meter, berbeda di setiap lapisan di atasnya, dan sebagian besar lokasi berskala besar pada akhirnya membutuhkan keduanya.
Perbandingan TL;DR
| Aspek | EMS | PQMS |
|---|---|---|
| Pertanyaan utama | Berapa banyak energi yang dikonsumsi, di mana, dan oleh apa? | Bagaimana kualitas pasokan, dan kapan ia mengganggu operasional? |
| Satuan utama | kWh, kVA, m³, Sm³ (W.A.G.E.S) | RMS sag/swell, % THD, tegangan puncak transien, flicker Pst/Plt |
| Laju pemindaian | 1 detik hingga 15 menit | Sub-siklus hingga milidetik (berbasis kejadian) |
| Standar acuan | ISO 50001, IEC 62053-22 (meter Class 0.5S) | IEEE 519-2022, IEC 61000-4-30, EN 50160 |
| Laporan tipikal | Konsumsi bulanan, ESG Scope 2, BCA Green Mark | Log kejadian, ringkasan kepatuhan IEEE 519, korespondensi utilitas |
| Keluaran ke operasional | Anggaran, peringatan anomali, pengungkapan ESG | Catatan kejadian forensik, spesifikasi ride-through, bukti sengketa utilitas |
| Tanpanya, Anda kehilangan | Visibilitas atas biaya dan emisi | Visibilitas atas mengapa beban kritis terputus |
Jika sebuah fasilitas terutama peduli pada biaya, emisi, atau sertifikasi, EMS adalah sistemnya. Jika ia terutama peduli pada keberlangsungan operasi peralatan sensitif, PQMS adalah sistemnya. Kasus di mana fasilitas peduli pada keduanya cukup umum sehingga penerapan terintegrasi menjadi standar bawaan EcoXplore untuk lokasi industri dan mission-critical.
Apa yang diukur EMS
EMS memantau sisi konsumsi. Fenomena yang dilacaknya:
- Energi aktif (kWh) pada titik asupan utama dan papan distribusi hilir.
- Permintaan (kVA, kW) dalam interval 15 menit atau 30 menit yang sesuai dengan jendela penagihan utilitas.
- Faktor daya untuk kepatuhan tarif.
- Submeter W.A.G.E.S (air, udara, gas, listrik, uap; water, air, gas, electricity, steam) pada tingkat yang diperlukan untuk mengatribusikan konsumsi ke proses, penyewa, atau aset.
Data tersimpan dalam sebuah historian, dinormalisasi terhadap variabel pemacu (volume produksi, cooling degree days, hunian), dan tampil sebagai KPI, ringkasan bulanan, serta paket tinjauan manajemen ISO 50001.
Laju sampel lambat karena tren konsumsi bergerak lambat. Interval 15 menit tidak melewatkan apa pun pada cerita konsumsi.
Apa yang diukur PQMS
PQMS memantau sisi pasokan. Fenomena yang dilacak sesuai IEC 61000-4-30:
- Voltage sag dan swell (RMS 10-siklus, agregasi Class A).
- Harmonik hingga orde ke-50 sesuai IEC 61000-4-7, dengan TDD dinilai terhadap IEEE 519-2022.
- Transien: impulsif (petir, switching) dan osilatori (capacitor switching).
- Ketidakseimbangan tegangan berdasarkan komponen simetris.
- Flicker (Pst, Plt) untuk lokasi dengan mesin las, arc furnace, atau beban variabel besar.
- Interharmonik, yang semakin relevan di tempat beban berpasangan inverter mendominasi.
Laju sampel cepat karena kejadian PQ berlangsung singkat. Meter yang mengagregasi ke rata-rata 15 menit akan melewatkan setiap sag dan setiap transien yang penting. Meter Class A sesuai IEC 61000-4-30 adalah satu-satunya meter yang dapat melaporkan kejadian PQ secara dapat dipertanggungjawabkan.
Zona tumpang tindih
EMS dan PQMS tumpang tindih tepat pada dua lapisan:
1. Meter berkelas revenue. Banyak meter modern (Schneider PowerLogic ION9000, Janitza UMG 605, Siemens Sentron PAC4200) dapat secara bersamaan berfungsi sebagai meter revenue Class 0.5S dan penganalisis PQ Class A. Satu perangkat, dua laporan.
2. Current transformer (CT) dan voltage transformer (VT). Trafo instrumen yang sama memasok kedua sistem. Penghematan pada CT adalah pengungkit biaya tunggal terbesar dalam penerapan terintegrasi.
Di atas meter, kedua sistem berbeda. EMS menggulung data tingkat menit ke dalam historian dan menghasilkan laporan bulanan. PQMS menangkap kejadian sub-siklus dan menghasilkan catatan forensik. Mencampur kedua aliran laporan membingungkan pembaca; pisahkan historian meskipun meter dibagi bersama.
Kapan EMS saja sudah cukup
Sebuah gedung perkantoran komersial tipikal (penyewa tunggal, target BCA Green Mark Platinum, tanpa beban IT kritis) membutuhkan EMS. Ia tidak membutuhkan PQMS karena:
- Tidak ada beban di lokasi yang memiliki sensitivitas ride-through yang membenarkan penangkapan kejadian berkelas forensik.
- Kualitas pasokan utilitas di Singapura cukup tinggi sehingga sisa paparan PQ dapat diterima.
- Kewajiban pelaporan (BCA Green Mark, MAS Scope 2) semuanya berada di sisi konsumsi.
Untuk lokasi seperti ini, EcoXplore menerapkan EMS saja. Menambahkan PQMS hanya akan menggelembungkan biaya tanpa mengubah keputusan apa pun.
Kapan PQMS saja sudah cukup
Sebuah pabrik (fab) semikonduktor dengan konsumsi yang stabil dan teranggarkan baik namun biaya downtime tinggi akibat kejadian PQ lebih membutuhkan PQMS daripada EMS. Fab tersebut mengetahui tren kWh-nya; ia tidak dapat memprediksi sag 100-ms berikutnya yang membuat satu batch wafer terbuang.
Untuk lokasi seperti ini, EcoXplore menerapkan PQMS dengan integrasi submeter opsional jika fasilitas ingin menambahkan pelacakan konsumsi di kemudian hari.
Kapan Anda membutuhkan keduanya
Lokasi yang membutuhkan keduanya:
- Pusat data: kewajiban Tier III/IV mencakup baik PUE (metrik konsumsi) maupun pencatatan kejadian PQ untuk forensik beban IT.
- Rumah sakit: ruang operasi dan ruang MRI membutuhkan penangkapan kejadian PQ; sisa rumah sakit membutuhkan pelaporan energi untuk pengungkapan keberlanjutan.
- Pabrik farmasi: persyaratan GMP mencakup baik keterlacakan energi maupun catatan penyimpangan.
- Kawasan industri multi-penyewa: submetering penyewa (EMS) berdampingan dengan pemantauan PQ pada common bus (PQMS).
Pendekatan standar EcoXplore untuk lokasi seperti ini: meter berkelas revenue bersama pada papan distribusi, meter PQ Class A khusus pada busbar kritis, dan dua historian terpisah yang dihubungkan melalui konvensi penandaan (tagging).
Sebuah contoh konkret
Sebuah grup rumah sakit regional yang EcoXplore terapkan di Johor pada 2024 menjalankan 36 titik pengukuran di dua gedung. Dua puluh dua di antaranya adalah unit Schneider ION9000 yang melayani baik fungsi EMS maupun PQMS (asupan utama blok A, feeder bus ruang operasi, feeder MRI, instalasi chiller). Empat belas adalah submeter Class 0.5S berbiaya lebih rendah pada papan penyewa di mana data PQ tidak diperlukan. Penerapan terintegrasi ini memangkas biaya CT dan pembangunan panel sekitar 30% dibandingkan penerapan paralel, sembari mempertahankan pelaporan Class A pada feeder yang penting.
Laporannya berbeda secara rapi: tinjauan bulanan ISO 50001 menarik dari historian EMS; korelasi kejadian PQ terhadap downtime ruang operasi menarik dari historian PQMS; keduanya merujuk tag meter yang sama sehingga profil konsumsi pada waktu kejadian dapat direkonstruksi di kedua alat.
Pertanyaan yang sering diajukan
Dapatkah satu meter menggantikan kedua sistem? Meter Class A berkelas revenue dapat menangkap data yang dibutuhkan kedua sistem. Sistem di atas meter (historian, dasbor, laporan) tetap terpisah karena templat laporan dan standarnya berbeda.
Apakah PQMS hanya EMS yang lebih mewah? Tidak. EMS berada di sisi konsumsi pada laju pemindaian lambat; PQMS berada di sisi pasokan pada resolusi sub-siklus. Instrumen berbeda, historian berbeda, laporan berbeda.
Mana yang harus diterapkan lebih dulu? EMS lebih dulu untuk sebagian besar lokasi, karena ia memberi pengembalian lebih cepat dalam hal tarif dan ESG. Tambahkan PQMS ketika kejadian PQ yang tercatat telah benar-benar menelan biaya, atau ketika beban sensitif sedang dipasang.
Apakah ISO 50001 mewajibkan data PQ? Tidak. ISO 50001 adalah standar manajemen energi. Data PQ relevan ketika kualitas yang buruk menurunkan efisiensi peralatan, tetapi ia bukan masukan utama.
Bicara dengan EcoXplore
Untuk lokasi yang mempertimbangkan EMS, PQMS, atau penerapan terintegrasi, tim teknik EcoXplore menawarkan tinjauan lokasi dan proposal anggaran. Lihat halaman PQMS, halaman EMS, atau hubungi kami langsung.
EMS so với PQMS: Mỗi hệ thống giám sát gì và khi nào bạn cần cả hai
Các khách hàng tiềm năng thường xuyên hỏi đội ngũ kỹ thuật của EcoXplore rằng liệu Hệ thống Quản lý Năng lượng (EMS) và Hệ thống Giám sát Chất lượng Điện năng (PQMS) có phải là cùng một thứ hay không, liệu hệ thống này có thể thay thế hệ thống kia hay không, và liệu chúng có thể dùng chung phần cứng hay không. Câu trả lời ngắn gọn: chúng chồng lấn tại đồng hồ đo, phân tách ở mọi tầng phía trên, và hầu hết các cơ sở lớn cuối cùng đều cần cả hai.
So sánh tóm tắt nhanh
| Khía cạnh | EMS | PQMS |
|---|---|---|
| Câu hỏi chính | Bao nhiêu năng lượng được tiêu thụ, ở đâu và bởi cái gì? | Chất lượng nguồn cấp ra sao, và khi nào nó gây nhiễu loạn vận hành? |
| Đơn vị chủ đạo | kWh, kVA, m³, Sm³ (W.A.G.E.S) | RMS sụt/vọt áp, % THD, điện áp đỉnh quá độ, nhấp nháy Pst/Plt |
| Tốc độ quét | 1 giây đến 15 phút | Dưới chu kỳ đến mili giây (theo sự kiện) |
| Tiêu chuẩn tham chiếu | ISO 50001, IEC 62053-22 (đồng hồ Class 0.5S) | IEEE 519-2022, IEC 61000-4-30, EN 50160 |
| Báo cáo điển hình | Tiêu thụ hàng tháng, ESG Scope 2, BCA Green Mark | Nhật ký sự kiện, bản tóm tắt tuân thủ IEEE 519, trao đổi với công ty điện lực |
| Đầu ra cho vận hành | Ngân sách, cảnh báo bất thường, công bố ESG | Hồ sơ sự kiện pháp y, đặc tả khả năng vượt qua sự cố (ride-through), bằng chứng tranh chấp với công ty điện lực |
| Nếu không có nó, bạn mất đi | Khả năng quan sát chi phí và phát thải | Khả năng quan sát lý do tại sao các phụ tải trọng yếu bị ngắt |
Nếu một cơ sở chủ yếu quan tâm đến chi phí, phát thải, hoặc chứng nhận, thì EMS là hệ thống phù hợp. Nếu nó chủ yếu quan tâm đến thời gian hoạt động liên tục của thiết bị nhạy cảm, thì PQMS là hệ thống phù hợp. Các trường hợp quan tâm đến cả hai phổ biến đến mức triển khai tích hợp là lựa chọn mặc định của EcoXplore cho các cơ sở công nghiệp và trọng yếu.
EMS đo lường những gì
EMS trang bị thiết bị đo cho phía tiêu thụ. Các hiện tượng mà nó theo dõi:
- Điện năng tác dụng (kWh) tại điểm tiếp nhận chính và các tủ phân phối hạ nguồn.
- Nhu cầu công suất (kVA, kW) trong các khoảng 15 phút hoặc 30 phút khớp với chu kỳ tính cước của công ty điện lực.
- Hệ số công suất để tuân thủ biểu giá.
- Đồng hồ phụ W.A.G.E.S nước, khí nén, gas, điện, hơi nước ở mức độ cần thiết để phân bổ mức tiêu thụ cho các quy trình, người thuê hoặc tài sản.
Dữ liệu được lưu trong một bộ lưu trữ lịch sử (historian), được chuẩn hóa theo các biến điều khiển (sản lượng sản xuất, số ngày-độ làm mát, mức độ sử dụng), và hiển thị dưới dạng KPI, bản tóm tắt hàng tháng, và các gói rà soát quản lý ISO 50001.
Tốc độ lấy mẫu chậm bởi vì các xu hướng tiêu thụ thay đổi chậm. Khoảng 15 phút không bỏ sót điều gì trong câu chuyện về tiêu thụ.
PQMS đo lường những gì
PQMS trang bị thiết bị đo cho phía nguồn cấp. Các hiện tượng được theo dõi theo IEC 61000-4-30:
- Sụt áp và vọt áp (RMS 10 chu kỳ, tổng hợp Class A).
- Sóng hài đến bậc thứ 50 theo IEC 61000-4-7, với TDD được chấm điểm theo IEEE 519-2022.
- Quá độ dạng xung (sét, đóng cắt) và dạng dao động (đóng cắt tụ điện).
- Mất cân bằng điện áp theo các thành phần đối xứng.
- Nhấp nháy (Pst, Plt) cho các cơ sở có máy hàn, lò hồ quang, hoặc các phụ tải biến đổi lớn.
- Sóng hài trung gian (interharmonics), ngày càng có ý nghĩa ở nơi mà các phụ tải ghép qua biến tần chiếm ưu thế.
Tốc độ lấy mẫu nhanh bởi vì các sự kiện chất lượng điện năng (PQ) diễn ra ngắn. Một đồng hồ tổng hợp thành giá trị trung bình 15 phút sẽ bỏ sót mọi sụt áp và mọi quá độ quan trọng. Đồng hồ Class A theo IEC 61000-4-30 là loại đồng hồ duy nhất có thể báo cáo một cách thuyết phục về các sự kiện PQ.
Vùng chồng lấn
EMS và PQMS chồng lấn tại đúng hai tầng:
1. Đồng hồ cấp đo đếm thương mại (revenue-grade). Nhiều đồng hồ hiện đại (Schneider PowerLogic ION9000, Janitza UMG 605, Siemens Sentron PAC4200) có thể đồng thời đóng vai trò đồng hồ đo đếm thương mại Class 0.5S và bộ phân tích PQ Class A. Một thiết bị, hai báo cáo.
2. Biến dòng (CT) và biến áp đo lường (VT). Cùng các máy biến đo lường này cấp tín hiệu cho cả hai hệ thống. Tiết kiệm chi phí CT là đòn bẩy chi phí lớn nhất trong các triển khai tích hợp.
Phía trên đồng hồ, các hệ thống phân tách. EMS gom dữ liệu cấp phút vào một historian và tạo ra các báo cáo hàng tháng. PQMS ghi nhận các sự kiện dưới chu kỳ và tạo ra các hồ sơ pháp y. Trộn lẫn hai luồng báo cáo này gây bối rối cho người đọc; hãy giữ các historian tách biệt ngay cả khi đồng hồ được dùng chung.
Khi nào chỉ cần EMS là đủ
Một tòa nhà văn phòng thương mại điển hình (một người thuê duy nhất, mục tiêu BCA Green Mark Platinum, không có phụ tải IT trọng yếu) cần một EMS. Nó không cần PQMS bởi vì:
- Không có phụ tải nào tại cơ sở có độ nhạy ride-through đủ để biện minh cho việc ghi nhận sự kiện cấp pháp y.
- Chất lượng nguồn cấp của công ty điện lực tại Singapore đủ cao đến mức mức phơi nhiễm PQ còn lại là chấp nhận được.
- Các nghĩa vụ báo cáo (BCA Green Mark, MAS Scope 2) đều thuộc phía tiêu thụ.
Đối với các cơ sở này, EcoXplore chỉ triển khai EMS. Việc thêm PQMS sẽ làm phình chi phí mà không thay đổi bất kỳ quyết định nào.
Khi nào chỉ cần PQMS là đủ
Một nhà máy bán dẫn (fab) có mức tiêu thụ ổn định, được hoạch định ngân sách tốt nhưng chi phí ngừng hoạt động cao do các sự kiện PQ thì cần PQMS hơn là EMS. Nhà máy này biết xu hướng kWh của mình; nhưng nó không thể dự đoán được lần sụt áp 100-ms tiếp theo làm hỏng cả một lô wafer.
Đối với các cơ sở này, EcoXplore triển khai PQMS với tùy chọn tích hợp đồng hồ phụ nếu cơ sở muốn bổ sung việc theo dõi tiêu thụ về sau.
Khi nào bạn cần cả hai
Các cơ sở cần cả hai:
- Trung tâm dữ liệu các nghĩa vụ Tier III/IV bao gồm cả PUE (chỉ số tiêu thụ) và ghi nhật ký sự kiện PQ để phân tích pháp y phụ tải IT.
- Bệnh viện các phòng mổ và phòng MRI cần ghi nhận sự kiện PQ; phần còn lại của bệnh viện cần báo cáo năng lượng cho việc công bố tính bền vững.
- Nhà máy dược phẩm các yêu cầu GMP bao gồm cả khả năng truy xuất năng lượng và hồ sơ sai lệch.
- Khu công nghiệp đa người thuê đo đếm phụ cho từng người thuê (EMS) song hành với giám sát PQ trên thanh cái chung (PQMS).
Cách tiếp cận tiêu chuẩn của EcoXplore cho các cơ sở này: đồng hồ cấp đo đếm thương mại dùng chung tại các tủ phân phối, đồng hồ PQ Class A chuyên dụng tại các thanh cái trọng yếu, và hai historian tách biệt được liên kết bằng các quy ước gắn thẻ.
Một ví dụ cụ thể
Một tập đoàn bệnh viện khu vực mà EcoXplore đã triển khai tại Johor vào năm 2024 vận hành 36 điểm đo trên hai tòa nhà. Hai mươi hai điểm là các bộ Schneider ION9000 phục vụ cả chức năng EMS và PQMS (các điểm tiếp nhận chính của tòa A, các tuyến cấp thanh cái phòng mổ, các tuyến cấp MRI, trạm máy làm lạnh). Mười bốn điểm là các đồng hồ phụ Class 0.5S chi phí thấp hơn tại các tủ của người thuê, nơi không yêu cầu dữ liệu PQ. Việc triển khai tích hợp đã cắt giảm chi phí CT và lắp ráp tủ khoảng 30% so với việc triển khai song song, đồng thời vẫn duy trì báo cáo Class A trên các tuyến cấp quan trọng.
Các báo cáo phân tách một cách rạch ròi: bản rà soát hàng tháng ISO 50001 lấy dữ liệu từ historian của EMS; việc đối chiếu sự kiện PQ với thời gian ngừng hoạt động của phòng mổ lấy dữ liệu từ historian của PQMS; cả hai cùng tham chiếu đến các thẻ đồng hồ giống nhau để có thể tái dựng hồ sơ tiêu thụ tại thời điểm sự kiện trên cả hai công cụ.
Câu hỏi thường gặp
Một đồng hồ duy nhất có thể thay thế cả hai hệ thống không? Một đồng hồ Class A cấp đo đếm thương mại có thể thu thập dữ liệu mà cả hai hệ thống cần. Các hệ thống phía trên đồng hồ (historian, bảng điều khiển, báo cáo) vẫn tách biệt bởi vì các mẫu báo cáo và tiêu chuẩn khác nhau.
PQMS có phải chỉ là một EMS cao cấp hơn không? Không. EMS thuộc phía tiêu thụ với tốc độ quét chậm; PQMS thuộc phía nguồn cấp với độ phân giải dưới chu kỳ. Khác thiết bị, khác historian, khác báo cáo.
Nên triển khai cái nào trước? EMS trước đối với hầu hết các cơ sở, vì nó hoàn vốn nhanh hơn về mặt biểu giá và ESG. Thêm PQMS khi một sự kiện PQ được ghi nhận đã thực sự gây tốn tiền, hoặc khi một phụ tải nhạy cảm đang được lắp đặt.
ISO 50001 có yêu cầu dữ liệu PQ không? Không. ISO 50001 là một tiêu chuẩn quản lý năng lượng. Dữ liệu PQ có liên quan khi chất lượng kém đang làm suy giảm hiệu suất thiết bị, nhưng nó không phải là đầu vào chính.
Trao đổi với EcoXplore
Đối với các cơ sở đang cân nhắc EMS, PQMS, hoặc một triển khai tích hợp, đội ngũ kỹ thuật của EcoXplore cung cấp dịch vụ rà soát hiện trường và đề xuất ngân sách. Xem trang PQMS, trang EMS, hoặc liên hệ trực tiếp với chúng tôi.
More About Ecoxplore
We are dedicated to empowering businesses with software and services that drive efficiency and growth
View more

.svg)

.svg)

.svg)
.svg)

More About Ecoxplore
We are dedicated to empowering businesses with software and services that drive efficiency and growth
View moreข้อมูลเพิ่มเติมเกี่ยวกับ Ecoxplore
เรามุ่งมั่นในการช่วยให้ธุรกิจของคุณทำงานได้อย่างมีประสิทธิภาพและเติบโตอย่างยั่งยืนด้วยซอฟต์แวร์และบริการของเรา
ดูเพิ่มเติมMore About Ecoxplore
We are dedicated to empowering businesses with software and services that drive efficiency and growth
View moreLebih Banyak Tentang Ecoxplore
Kami berdedikasi untuk memberdayakan bisnis dengan perangkat lunak dan layanan yang mendorong efisiensi dan pertumbuhan
Lihat lebih banyakMore About Ecoxplore
We are dedicated to empowering businesses with software and services that drive efficiency and growth
View moreLebih Banyak Tentang Ecoxplore
Kami berdedikasi untuk memberdayakan bisnis melalui perangkat lunak dan layanan yang mendorong efisiensi serta pertumbuhan.
Lihat selengkapnyaMore About Ecoxplore
We are dedicated to empowering businesses with software and services that drive efficiency and growth
View moreHiểu thêm về Ecoxplore
Chúng tôi cam kết trao quyền cho các doanh nghiệp bằng phần mềm và dịch vụ giúp tăng cường hiệu quả và phát triển
Xem thêm