


.svg)





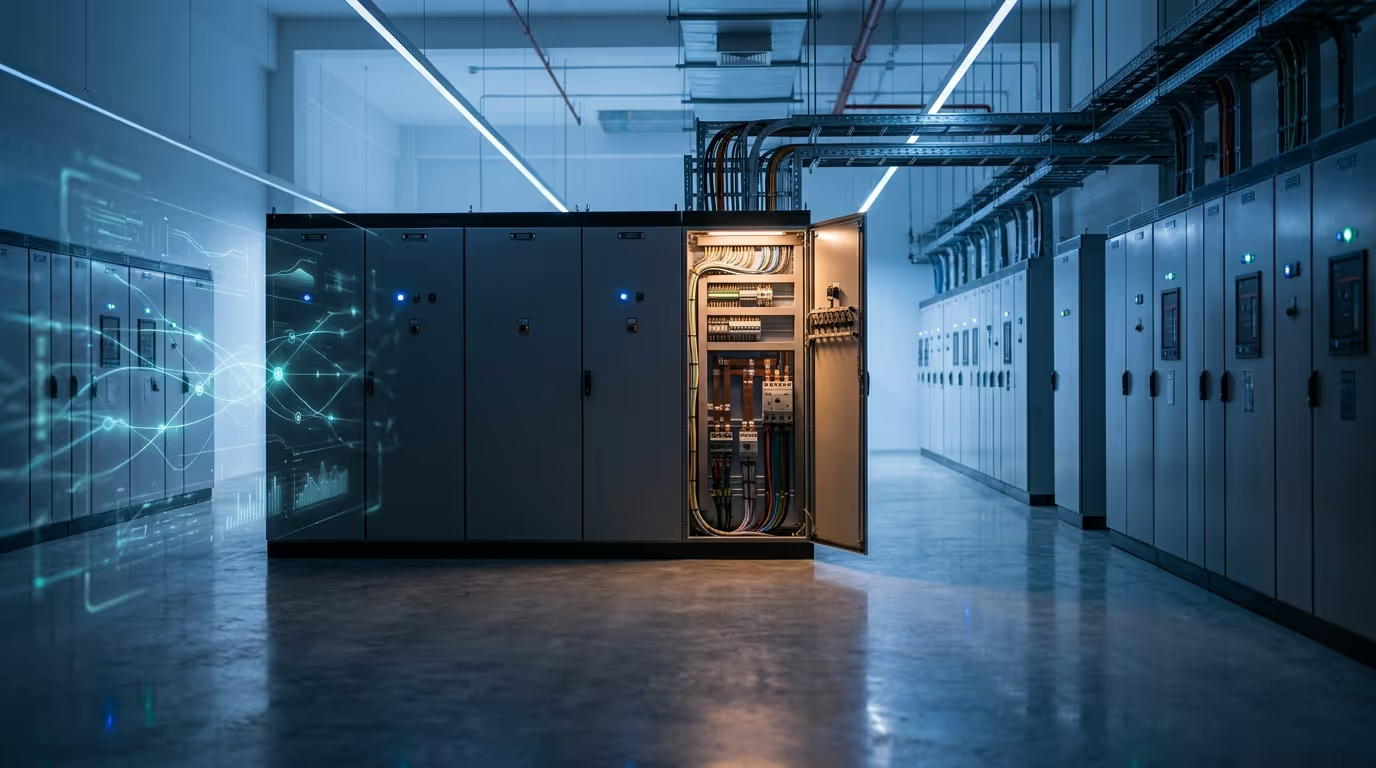


Energy Management System (EMS) — ISO 50001, BCA Green Mark and What an EMS Actually Tracks

Energy is the only line item on most facility ledgers that varies daily, is metered by someone else, and is consumed by equipment the facilities team rarely controls. An Energy Management System (EMS) is the data-and-process platform that turns this opaque flow into a managed budget.
This page covers what an EMS does at the hardware and software layers, how the ISO 50001 standard frames the work, the compliance regimes EMS data feeds in Singapore and the wider region, and how EcoXplore deploys and operates EMS programmes.
What an EMS actually does
An EMS combines four functions:
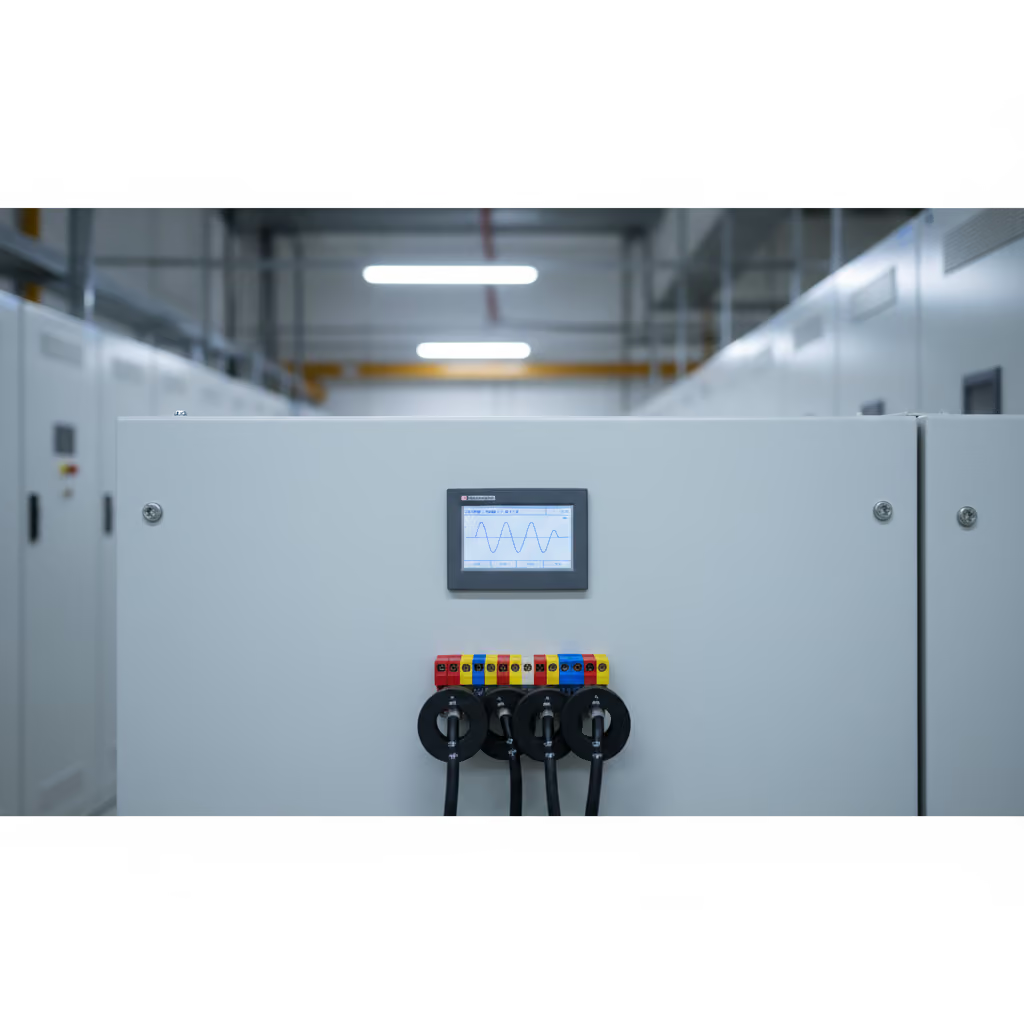
- Submetering. Granular measurement of electricity, water, air, gas, and steam (W.A.G.E.S) at points downstream of the utility revenue meter. Without submetering, an energy programme can only attribute consumption to the whole building.
- Aggregation and historian. A time-series database that stores meter data with the engineering tags and asset hierarchy the operations team works in (chiller-1, AHU-3, tenant-A).
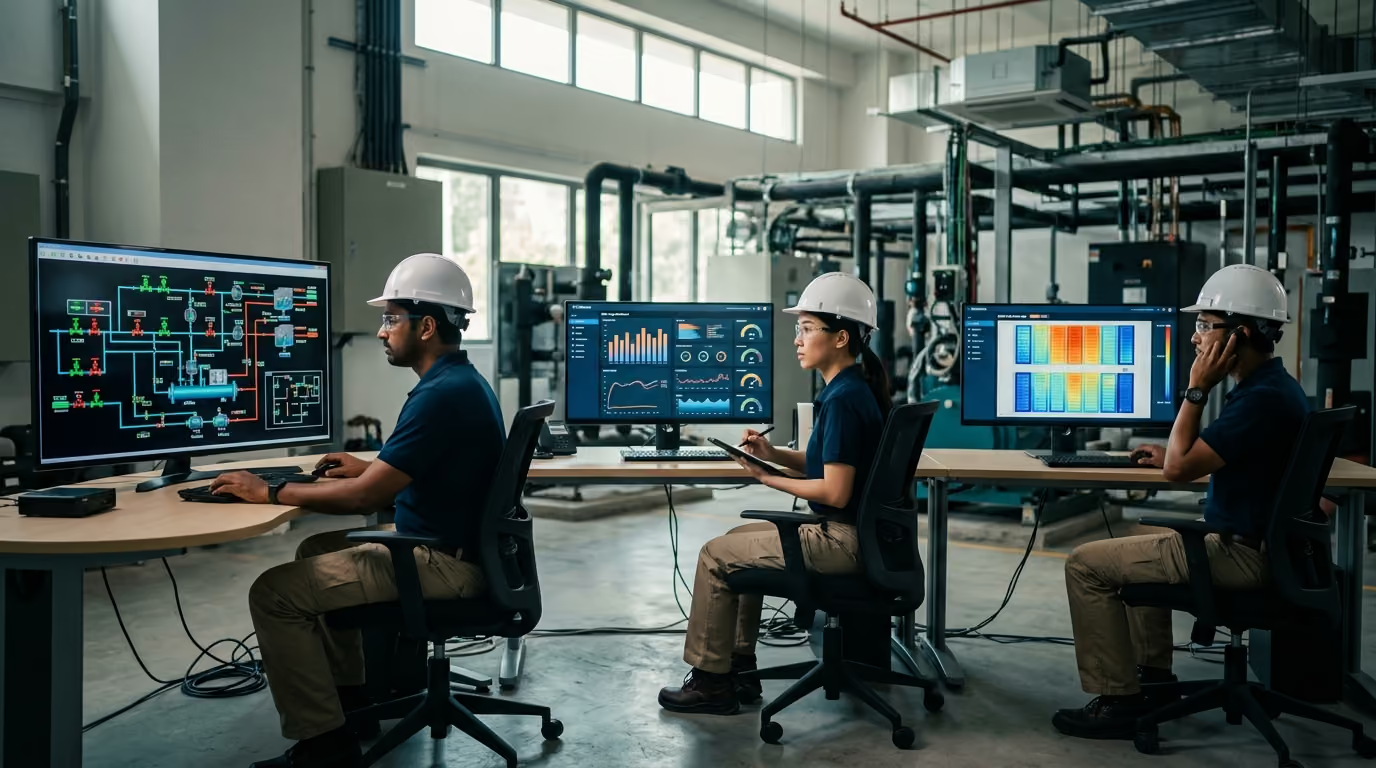
- Dashboards and reports. KPI views for plant operators, monthly summaries for senior managers, annual submissions for compliance bodies.
- Anomaly detection. Alerts when a baseline is breached or when a load profile shifts in a way that suggests degradation.
The order matters. Without good submetering, dashboards lie. Without a historian, anomaly detection has no comparison window. Many EMS projects fail at the first step because the meter point list was finalised before the consumption pattern was understood.
ISO 50001 — what the standard requires from the data layer
ISO 50001:2018 frames energy management as a continuous-improvement loop along the same plan-do-check-act pattern as ISO 9001 and ISO 14001. The data-layer obligations are concrete:
- Energy review. A documented analysis of significant energy uses (SEUs), past consumption, and the variables that drive it (production volume, weather, occupancy).
- Energy baseline (EnB). A reference period against which performance is measured. The baseline must be defensible, with the variables that influence consumption normalised mathematically, not waved at.
- Energy performance indicators (EnPIs). Numbers that allow performance to be tracked. kWh per unit of production is the classic example; kWh per square metre per cooling degree day is more honest for buildings.
- Action plan and tracking. Documented improvement projects with measurable targets, and a process for measuring whether the targets were hit.
- Internal audit and management review. Evidence the system is being used.
An EMS that does not support normalisation of EnPIs against driver variables is not enough to maintain ISO 50001 certification, regardless of how attractive the dashboards are. Buyers should ask vendors to demonstrate the regression and normalisation engine, not just the chart library.
Hardware layer
A typical EMS hardware stack for a mid-size industrial site:
- Class 0.5 electrical meters at the main intake and each major distribution board. Class 0.5 means accuracy to within ±0.5% of reading; this matches IEC 62053-22 Class 0.5S.
- Current transformers (CTs). Split-core for retrofits, solid-core for new builds. The CT ratio dictates measurement range; oversized CTs sacrifice low-load accuracy.
- Modbus RTU / TCP, BACnet/IP, or M-Bus as the field protocol. BACnet/IP is preferred where the EMS will integrate with a Building Management System.
- Flow meters for water, compressed air, and steam, sized to the pipe and the expected flow range.
- Gas meters where natural gas or LPG is consumed; for environmental reporting these need to support pressure and temperature compensation.
- Gateway / edge controller that pulls data from the field protocols and forwards to the historian.
For W.A.G.E.S coverage at sites that consume all five utilities, a small refinery might run 60 to 120 measurement points; a commercial office might run 15 to 30.
Software layer
The software stack divides into three tiers:
Historian. Time-series storage that handles tag explosion gracefully. Common choices: vendor-bundled SQL backends, OSIsoft PI for larger sites, InfluxDB or TimescaleDB for cloud-native builds.
Dashboards. Live displays for operations, summary boards for management, and detail screens for engineers tracking specific assets. Good dashboards refuse to show numbers the underlying data cannot support; bad dashboards average over null intervals and quietly mislead.
Reports. Recurring exports for ISO 50001 management review, BCA Green Mark submissions, MAS climate disclosure, and the GHG Scope 2 inventory. Each has its own template requirements, and EMS deployments that ship without these built in tend to be re-quoted within a year.
EMS vs PQMS — a brief callout
An EMS measures consumption; a Power Quality Monitoring System (PQMS) measures the quality of the supply. They share revenue meters where the hardware supports both functions, but the reports and standards differ. For a fuller discussion see EMS vs PQMS — what each monitors.
Compliance regimes EMS data feeds
In Singapore alone, an EMS feeds at least three reporting streams:
- BCA Green Mark NRB:2015 (and the Healthcare 2019 and Data Centre 2019 variants) require submetering at defined granularity. Tenant-level meters, lighting circuit grouping, and chiller plant submetering are the common audit findings. See the BCA Green Mark energy monitoring guide.
- MAS Guidelines on Environmental Risk Management apply to financial institutions and increasingly to their counterparties. Scope 2 emissions are derived from EMS kWh figures.
- GHG Protocol Scope 2 reporting (both location-based and market-based) requires kWh consumption by year, by grid region, with documentary backup.
Across the region:
- Thailand: DEDE (Department of Alternative Energy Development and Efficiency) targets and TEFC (Thailand Energy Efficiency Centre) studies use EMS data.
- Indonesia: KESDM Permen 33/2023 sets energy management requirements for designated users.
- Malaysia: SEDA and EMEER 2008 set efficient management requirements for installations exceeding 3,000,000 kWh per six months.
- Vietnam: MOIT Energy Efficiency Law 50/2010 and circular 19/2016 set obligations for designated energy consumers.
EcoXplore's approach
EcoXplore designs and builds EMS programmes around the customer's compliance obligation, not the meter catalogue. The standard engagement:
- Pre-deployment review. Identify the reports the EMS must produce, then work backward to the meter point list. Often surfaces submetering gaps that would have failed an audit later.
- Point-list design. Drawings, naming convention, asset hierarchy aligned to the operations team's existing tag structure.
- Procurement and install. BCA L4 builds with ISO 14001 environmental controls on site work.
- Commissioning. End-to-end test of each meter through the historian to the report templates. No site is signed off until ISO 50001-shaped reports run cleanly.
- Operate and improve. Quarterly reviews, anomaly tuning, baseline refresh.
Sample dashboards and report templates are available on request.
Frequently asked questions
What is the difference between an EMS and a BMS? A BMS controls HVAC, lighting, and access. An EMS measures and reports on energy. The two integrate, often through BACnet/IP, but the BMS makes decisions in real time and the EMS produces evidence over time.
Do I need ISO 50001 certification to deploy an EMS? No. Many sites deploy EMS for cost control or BCA Green Mark alone. ISO 50001 is the framework if formal certification is required by an investor, a head office mandate, or a tendering requirement.
Can EMS data be used for ESG reporting? Yes. Scope 2 emissions in any common ESG framework (GRI, SASB, TCFD, ISSB) are derived from kWh consumption multiplied by a grid emissions factor. EMS exports the kWh, your sustainability team applies the factor, finance signs the disclosure.
How small a site is too small for an EMS? A monthly utility bill of around SGD 5,000 to 10,000 starts to justify submetering. Below that, manual logs and spreadsheet tracking are usually cheaper.
How long does deployment take? Typical timeline: four to twelve weeks from kick-off to a live historian for a mid-size commercial site; three to nine months for a multi-utility industrial site with full ISO 50001 reporting wired in.
Talk to EcoXplore's energy team
Site reviews, budgetary proposals, and sample report walkthroughs are available from the EcoXplore contact page. For BCA Green Mark pre-assessment specifically, see the dedicated Green Mark energy monitoring guide.




能源管理系统(EMS):ISO 50001、BCA Green Mark 以及 EMS 实际追踪的内容
在大多数设施账目中,能源是唯一一项每天波动、由他人计量、且由设施团队几乎无法掌控的设备所消耗的支出项目。能源管理系统(EMS)正是把这种不透明的流向转化为可管理预算的数据与流程平台。
本页介绍 EMS 在硬件层与软件层的功能、ISO 50001 标准如何为这项工作建立框架、EMS 数据在新加坡及更广泛区域所支撑的合规体系,以及 EcoXplore 如何部署和运营 EMS 项目。
EMS 实际上做些什么
EMS 整合了四项功能:
- 子计量。在公用事业计费表下游的各点位,对电、水、空气、燃气和蒸汽(W.A.G.E.S)进行精细测量。没有子计量,能源项目只能把消耗归结到整栋建筑。
- 汇聚与历史数据库。一套时序数据库,按运营团队所使用的工程标签和资产层级(chiller-1、AHU-3、tenant-A)存储计量数据。
- 仪表板与报告。面向工厂操作人员的 KPI 视图、面向高级管理层的月度摘要、面向合规机构的年度提交材料。
- 异常检测。当基准被突破,或负荷曲线以暗示性能退化的方式发生偏移时发出告警。
顺序很重要。没有良好的子计量,仪表板就会撒谎。没有历史数据库,异常检测就没有可供比较的窗口。许多 EMS 项目在第一步就失败,因为计量点位清单在消耗模式被理解之前就已经定稿。
ISO 50001:标准对数据层的要求
ISO 50001:2018 将能源管理框定为一个持续改进的循环,遵循与 ISO 9001 和 ISO 14001 相同的「计划-执行-检查-处理」模式。对数据层的义务是具体明确的:
- 能源评审。对重大能源使用(SEU)、过往消耗以及驱动消耗的变量(生产量、天气、人员占用情况)进行有据可查的分析。
- 能源基准(EnB)。用以衡量绩效的参照期。基准必须站得住脚,影响消耗的变量须经数学归一化处理,而不是随意带过。
- 能源绩效指标(EnPI)。用于追踪绩效的数字。每单位产量的 kWh 是经典示例;对建筑而言,每平方米每冷却度日的 kWh 更为诚实。
- 行动计划与追踪。有据可查、设有可衡量目标的改进项目,以及衡量目标是否达成的流程。
- 内部审核与管理评审。系统正被使用的证据。
无论仪表板多么吸引人,一套无法支持将 EnPI 针对驱动变量进行归一化的 EMS,都不足以维持 ISO 50001 认证。买家应要求供应商演示其回归与归一化引擎,而不只是图表库。
硬件层
中型工业站点的典型 EMS 硬件架构:
- 0.5 级电表安装于主进线及各主要配电柜处。0.5 级表示精度在读数的 ±0.5% 以内;这对应 IEC 62053-22 的 0.5S 级。
- 电流互感器(CT)。改造工程用开口式,新建工程用闭口式。CT 变比决定测量范围;CT 选型过大会牺牲低负荷精度。
- Modbus RTU / TCP、BACnet/IP 或 M-Bus作为现场协议。当 EMS 需要与楼宇管理系统集成时,首选 BACnet/IP。
- 流量计用于水、压缩空气和蒸汽,按管道及预期流量范围选型。
- 燃气表用于消耗天然气或液化石油气(LPG)的场合;用于环境报告时,这些表需支持压力和温度补偿。
- 网关 / 边缘控制器从现场协议拉取数据并转发至历史数据库。
对于消耗全部五种公用事业的站点,要实现 W.A.G.E.S 覆盖,一座小型炼油厂可能需要 60 至 120 个测量点位;一间商业办公楼可能需要 15 至 30 个。
软件层
软件架构分为三层:
历史数据库。能够从容应对标签激增的时序存储。常见选择:供应商捆绑的 SQL 后端、面向大型站点的 OSIsoft PI、面向云原生架构的 InfluxDB 或 TimescaleDB。
仪表板。面向运营的实时显示、面向管理层的摘要看板,以及面向工程师追踪特定资产的详情界面。优秀的仪表板拒绝显示底层数据无法支撑的数字;糟糕的仪表板则在空值区间上取平均,悄然误导。
报告。用于 ISO 50001 管理评审、BCA Green Mark 提交、MAS 气候披露以及 GHG 范围 2 清单的周期性导出。每一类都有各自的模板要求,那些交付时未内置这些功能的 EMS 部署,往往在一年内就被重新报价。
EMS 与 PQMS:简要说明
EMS 测量消耗;电能质量监测系统(PQMS)测量供电质量。在硬件同时支持两种功能的情况下,它们共用计费表,但报告与标准各不相同。更完整的讨论请参阅EMS 与 PQMS:各自监测什么。
EMS 数据所支撑的合规体系
仅在新加坡,EMS 就支撑至少三条报告流:
- BCA Green Mark NRB:2015(以及 Healthcare 2019 和 Data Centre 2019 变体)要求按既定粒度进行子计量。租户级计量表、照明回路分组以及冷水机组子计量是常见的审核发现项。请参阅 BCA Green Mark 能源监测指南。
- MAS《环境风险管理指引》适用于金融机构,并日益适用于其交易对手。范围 2 排放由 EMS 的 kWh 数据推算得出。
- GHG Protocol 范围 2 报告(基于地点和基于市场两种方法)要求按年度、按电网区域提供 kWh 消耗量,并附有文件佐证。
放眼整个区域:
- 泰国:DEDE(替代能源开发与效率司)目标及 TEFC(泰国能源效率中心)研究采用 EMS 数据。
- 印度尼西亚:KESDM Permen 33/2023 为指定用户设定能源管理要求。
- 马来西亚:SEDA 及 EMEER 2008 为每六个月用电超过 3,000,000 kWh 的设施设定高效管理要求。
- 越南:MOIT《能源效率法》50/2010 及通函 19/2016 为指定能源消耗者设定义务。
EcoXplore 的方法
EcoXplore 围绕客户的合规义务来设计和构建 EMS 项目,而非围绕计量表目录。标准的合作流程:
- 部署前评审。先确定 EMS 必须产出的报告,再倒推计量点位清单。这往往会暴露出本会在日后导致审核不通过的子计量缺口。
- 点位清单设计。图纸、命名规范、资产层级与运营团队既有的标签结构对齐。
- 采购与安装。采用 BCA L4 资质施工,现场作业带有 ISO 14001 环境管控。
- 调试。对每一台计量表从历史数据库直至报告模板进行端到端测试。在 ISO 50001 格式的报告能够顺畅运行之前,任何站点都不予签收。
- 运营与改进。季度评审、异常调优、基准刷新。
示例仪表板和报告模板可应要求提供。
常见问题
EMS 与 BMS 有什么区别?BMS 控制 HVAC、照明和门禁。EMS 测量并报告能源。两者会集成,往往通过 BACnet/IP,但 BMS 实时做出决策,而 EMS 则随时间积累证据。
部署 EMS 需要 ISO 50001 认证吗?不需要。许多站点仅为成本控制或 BCA Green Mark 而部署 EMS。当投资方、总部强制要求或招标要求需要正式认证时,ISO 50001 才是相应的框架。
EMS 数据可用于 ESG 报告吗?可以。任何常见 ESG 框架(GRI、SASB、TCFD、ISSB)中的范围 2 排放,都是由 kWh 消耗量乘以电网排放因子推算得出。EMS 导出 kWh,您的可持续发展团队套用因子,财务部门签署披露。
多小的站点才算太小、不适合用 EMS?当每月公用事业账单约为 SGD 5,000 至 10,000 时,就开始值得进行子计量。低于此值,手工记录和电子表格追踪通常更划算。
部署需要多长时间?典型时间线:中型商业站点从启动到历史数据库上线为四到十二周;具备完整 ISO 50001 报告接入的多公用事业工业站点为三到九个月。
联系 EcoXplore 能源团队
站点评审、预算方案以及示例报告演示可通过 EcoXplore 联系页面获取。如专门针对 BCA Green Mark 预评估,请参阅专门的 Green Mark 能源监测指南。
ระบบบริหารจัดการพลังงาน (EMS) : ISO 50001, BCA Green Mark และสิ่งที่ EMS ติดตามวัดผลจริง
พลังงานเป็นรายการเดียวในบัญชีค่าใช้จ่ายของอาคารส่วนใหญ่ที่ผันแปรในแต่ละวัน ถูกมิเตอร์วัดโดยบุคคลอื่น และถูกใช้ไปกับอุปกรณ์ที่ทีมบริหารอาคารแทบไม่มีสิทธิ์ควบคุม ระบบบริหารจัดการพลังงาน (EMS) คือแพลตฟอร์มข้อมูลและกระบวนการที่เปลี่ยนกระแสที่มองไม่เห็นนี้ให้กลายเป็นงบประมาณที่บริหารจัดการได้
หน้านี้ครอบคลุมสิ่งที่ EMS ทำในระดับฮาร์ดแวร์และซอฟต์แวร์ วิธีที่มาตรฐาน ISO 50001 วางกรอบงานนี้ ระบอบการปฏิบัติตามข้อกำหนดที่ใช้ข้อมูลจาก EMS เป็นแหล่งป้อนในสิงคโปร์และในภูมิภาคที่กว้างขึ้น และวิธีที่ EcoXplore ติดตั้งและดำเนินงานโครงการ EMS
EMS ทำหน้าที่อะไรจริง ๆ
EMS รวมสี่ฟังก์ชันเข้าด้วยกัน:
- การวัดย่อย (Submetering) การวัดที่ละเอียดของไฟฟ้า น้ำ อากาศ ก๊าซ และไอน้ำ (W.A.G.E.S) ณ จุดที่อยู่ถัดจากมิเตอร์คิดเงินของการไฟฟ้า หากปราศจากการวัดย่อย โครงการพลังงานจะสามารถระบุการใช้พลังงานได้เพียงในระดับทั้งอาคารเท่านั้น
- การรวมข้อมูลและฐานข้อมูลย้อนหลัง (Historian) ฐานข้อมูลแบบอนุกรมเวลาที่จัดเก็บข้อมูลมิเตอร์พร้อมแท็กทางวิศวกรรมและลำดับชั้นของสินทรัพย์ที่ทีมปฏิบัติการใช้งานอยู่ (chiller-1, AHU-3, tenant-A)
- แดชบอร์ดและรายงาน มุมมอง KPI สำหรับผู้ปฏิบัติงานในโรงงาน สรุปรายเดือนสำหรับผู้บริหารระดับสูง และรายงานประจำปีสำหรับหน่วยงานกำกับดูแล
- การตรวจจับความผิดปกติ การแจ้งเตือนเมื่อค่าฐานถูกฝ่าฝืน หรือเมื่อโปรไฟล์โหลดเปลี่ยนไปในลักษณะที่บ่งชี้ถึงการเสื่อมสภาพ
ลำดับมีความสำคัญ หากการวัดย่อยไม่ดี แดชบอร์ดก็จะโกหก หากไม่มีฐานข้อมูลย้อนหลัง การตรวจจับความผิดปกติก็ไม่มีช่วงเวลาเปรียบเทียบ โครงการ EMS จำนวนมากล้มเหลวตั้งแต่ขั้นตอนแรก เพราะรายการจุดติดตั้งมิเตอร์ถูกสรุปก่อนที่จะเข้าใจรูปแบบการใช้พลังงาน
ISO 50001 : สิ่งที่มาตรฐานนี้กำหนดต่อชั้นข้อมูล
ISO 50001:2018 วางกรอบการบริหารจัดการพลังงานให้เป็นวงรอบการปรับปรุงอย่างต่อเนื่องตามรูปแบบ plan-do-check-act เช่นเดียวกับ ISO 9001 และ ISO 14001 ภาระผูกพันในระดับชั้นข้อมูลนั้นเป็นรูปธรรม:
- การทบทวนพลังงาน (Energy review) การวิเคราะห์ที่มีเอกสารกำกับเกี่ยวกับการใช้พลังงานที่มีนัยสำคัญ (SEUs) การใช้พลังงานในอดีต และตัวแปรที่ขับเคลื่อนการใช้พลังงานนั้น (ปริมาณการผลิต สภาพอากาศ จำนวนผู้ใช้อาคาร)
- ค่าฐานพลังงาน (EnB) ช่วงเวลาอ้างอิงที่ใช้วัดสมรรถนะ ค่าฐานต้องสามารถปกป้องได้ โดยมีการปรับค่าตัวแปรที่มีอิทธิพลต่อการใช้พลังงานในเชิงคณิตศาสตร์ ไม่ใช่กล่าวอ้างลอย ๆ
- ตัวชี้วัดสมรรถนะพลังงาน (EnPIs) ตัวเลขที่ทำให้สามารถติดตามสมรรถนะได้ kWh ต่อหน่วยการผลิตเป็นตัวอย่างคลาสสิก ส่วน kWh ต่อตารางเมตรต่อ cooling degree day นั้นซื่อตรงกว่าสำหรับอาคาร
- แผนปฏิบัติการและการติดตามผล โครงการปรับปรุงที่มีเอกสารกำกับพร้อมเป้าหมายที่วัดผลได้ และกระบวนการสำหรับวัดว่าบรรลุเป้าหมายหรือไม่
- การตรวจประเมินภายในและการทบทวนของฝ่ายบริหาร หลักฐานว่าระบบถูกนำไปใช้งานจริง
EMS ที่ไม่รองรับการปรับค่า EnPIs ตามตัวแปรขับเคลื่อนนั้นไม่เพียงพอที่จะรักษาการรับรอง ISO 50001 ไว้ได้ ไม่ว่าแดชบอร์ดจะสวยงามเพียงใดก็ตาม ผู้ซื้อควรขอให้ผู้จำหน่ายสาธิตเครื่องมือวิเคราะห์การถดถอยและการปรับค่ามาตรฐาน ไม่ใช่เพียงไลบรารีของแผนภูมิเท่านั้น
ชั้นฮาร์ดแวร์
ชุดฮาร์ดแวร์ EMS โดยทั่วไปสำหรับไซต์อุตสาหกรรมขนาดกลาง:
- มิเตอร์ไฟฟ้า Class 0.5 ที่จุดรับไฟหลักและที่แผงจ่ายไฟหลักแต่ละจุด Class 0.5 หมายถึงความแม่นยำภายใน ±0.5% ของค่าที่อ่านได้ ซึ่งสอดคล้องกับ IEC 62053-22 Class 0.5S
- หม้อแปลงกระแส (CTs) แบบ split-core สำหรับการติดตั้งเพิ่มเติม และแบบ solid-core สำหรับงานก่อสร้างใหม่ อัตราส่วน CT เป็นตัวกำหนดช่วงการวัด CTs ที่มีขนาดใหญ่เกินไปจะแลกมาด้วยความแม่นยำที่โหลดต่ำ
- Modbus RTU / TCP, BACnet/IP หรือ M-Bus เป็นโปรโตคอลภาคสนาม BACnet/IP เป็นที่นิยมในกรณีที่ EMS จะต้องเชื่อมต่อกับ ระบบบริหารจัดการอาคาร (Building Management System)
- มิเตอร์วัดอัตราการไหล สำหรับน้ำ อากาศอัด และไอน้ำ โดยเลือกขนาดให้เหมาะกับท่อและช่วงอัตราการไหลที่คาดไว้
- มิเตอร์วัดก๊าซ ในจุดที่มีการใช้ก๊าซธรรมชาติหรือ LPG สำหรับการรายงานด้านสิ่งแวดล้อม มิเตอร์เหล่านี้ต้องรองรับการชดเชยความดันและอุณหภูมิ
- เกตเวย์ / edge controller ที่ดึงข้อมูลจากโปรโตคอลภาคสนามและส่งต่อไปยังฐานข้อมูลย้อนหลัง
สำหรับการครอบคลุม W.A.G.E.S ที่ไซต์ซึ่งใช้สาธารณูปโภคครบทั้งห้าประเภท โรงกลั่นขนาดเล็กอาจมีจุดวัดราว 60 ถึง 120 จุด ขณะที่อาคารสำนักงานเชิงพาณิชย์อาจมีราว 15 ถึง 30 จุด
ชั้นซอฟต์แวร์
ชุดซอฟต์แวร์แบ่งออกเป็นสามระดับ:
ฐานข้อมูลย้อนหลัง (Historian) ที่จัดเก็บแบบอนุกรมเวลาซึ่งรับมือกับการเพิ่มจำนวนแท็กได้อย่างราบรื่น ตัวเลือกที่พบบ่อย: ฐานข้อมูล SQL ที่มาพร้อมกับผลิตภัณฑ์ของผู้จำหน่าย, OSIsoft PI สำหรับไซต์ขนาดใหญ่, InfluxDB หรือ TimescaleDB สำหรับงานที่ออกแบบมาเพื่อคลาวด์โดยเฉพาะ
แดชบอร์ด หน้าจอแสดงผลแบบเรียลไทม์สำหรับฝ่ายปฏิบัติ บอร์ดสรุปสำหรับฝ่ายบริหาร และหน้าจอรายละเอียดสำหรับวิศวกรที่ติดตามสินทรัพย์เฉพาะ แดชบอร์ดที่ดีจะปฏิเสธที่จะแสดงตัวเลขที่ข้อมูลพื้นฐานไม่สามารถรองรับได้ ส่วนแดชบอร์ดที่ไม่ดีจะเฉลี่ยค่าทับช่วงที่เป็น null และทำให้เข้าใจผิดอย่างเงียบ ๆ
รายงาน การส่งออกข้อมูลที่เกิดขึ้นซ้ำสำหรับการทบทวนของฝ่ายบริหารตาม ISO 50001 การยื่นเอกสาร BCA Green Mark การเปิดเผยข้อมูลด้านสภาพภูมิอากาศของ MAS และบัญชีรายการ GHG Scope 2 แต่ละรายการมีข้อกำหนดแม่แบบของตนเอง และการติดตั้ง EMS ที่ส่งมอบโดยไม่มีสิ่งเหล่านี้ในตัวมักจะถูกขอใบเสนอราคาใหม่ภายในหนึ่งปี
EMS เทียบกับ PQMS : หมายเหตุโดยย่อ
EMS วัดการใช้พลังงาน ส่วน ระบบตรวจติดตามคุณภาพไฟฟ้า (Power Quality Monitoring System หรือ PQMS) วัดคุณภาพของแหล่งจ่ายไฟ ทั้งสองระบบใช้มิเตอร์คิดเงินร่วมกันในจุดที่ฮาร์ดแวร์รองรับทั้งสองฟังก์ชัน แต่รายงานและมาตรฐานนั้นแตกต่างกัน สำหรับการอภิปรายที่ละเอียดกว่านี้ ดู EMS เทียบกับ PQMS : แต่ละระบบตรวจติดตามอะไร
ระบอบการปฏิบัติตามข้อกำหนดที่ใช้ข้อมูลจาก EMS
ในสิงคโปร์เพียงประเทศเดียว EMS ป้อนข้อมูลให้กับกระแสการรายงานอย่างน้อยสามสาย:
- BCA Green Mark NRB:2015 (รวมถึงรุ่น Healthcare 2019 และ Data Centre 2019) กำหนดให้มีการวัดย่อยตามระดับความละเอียดที่กำหนดไว้ มิเตอร์ระดับผู้เช่า การจัดกลุ่มวงจรแสงสว่าง และการวัดย่อยของระบบเครื่องทำความเย็นเป็นข้อค้นพบจากการตรวจประเมินที่พบบ่อย ดู คู่มือการตรวจติดตามพลังงานตาม BCA Green Mark
- MAS Guidelines on Environmental Risk Management ใช้บังคับกับสถาบันการเงินและขยายไปถึงคู่สัญญาของสถาบันเหล่านั้นมากขึ้นเรื่อย ๆ การปล่อยก๊าซ Scope 2 คำนวณมาจากค่า kWh ของ EMS
- การรายงาน GHG Protocol Scope 2 (ทั้งแบบอิงสถานที่และอิงตลาด) กำหนดให้รายงานการใช้พลังงาน kWh ต่อปี แยกตามภูมิภาคของโครงข่ายไฟฟ้า พร้อมหลักฐานเอกสารประกอบ
ทั่วทั้งภูมิภาค:
- ไทย: เป้าหมายของ DEDE (กรมพัฒนาพลังงานทดแทนและอนุรักษ์พลังงาน) และการศึกษาของ TEFC (Thailand Energy Efficiency Centre) ใช้ข้อมูลจาก EMS
- อินโดนีเซีย: KESDM Permen 33/2023 กำหนดข้อกำหนดด้านการบริหารจัดการพลังงานสำหรับผู้ใช้ที่ถูกกำหนด
- มาเลเซีย: SEDA และ EMEER 2008 กำหนดข้อกำหนดการบริหารอย่างมีประสิทธิภาพสำหรับสถานประกอบการที่ใช้พลังงานเกิน 3,000,000 kWh ต่อหกเดือน
- เวียดนาม: MOIT Energy Efficiency Law 50/2010 และ circular 19/2016 กำหนดภาระผูกพันสำหรับผู้ใช้พลังงานที่ถูกกำหนด
แนวทางของ EcoXplore
EcoXplore ออกแบบและสร้างโครงการ EMS โดยยึดภาระการปฏิบัติตามข้อกำหนดของลูกค้าเป็นศูนย์กลาง ไม่ใช่ยึดแคตตาล็อกมิเตอร์ ขอบเขตงานมาตรฐาน:
- การทบทวนก่อนการติดตั้ง ระบุรายงานที่ EMS ต้องผลิตออกมา จากนั้นย้อนกลับไปจัดทำรายการจุดติดตั้งมิเตอร์ มักจะเผยให้เห็นช่องว่างของการวัดย่อยที่อาจทำให้ไม่ผ่านการตรวจประเมินในภายหลัง
- การออกแบบรายการจุดติดตั้ง แบบเขียน ระบบการตั้งชื่อ และลำดับชั้นของสินทรัพย์ที่สอดคล้องกับโครงสร้างแท็กที่ทีมปฏิบัติการมีอยู่เดิม
- การจัดซื้อจัดจ้างและการติดตั้ง งานก่อสร้างระดับ BCA L4 พร้อมการควบคุมด้านสิ่งแวดล้อมตาม ISO 14001 ในงานหน้างาน
- การทดสอบและเริ่มเดินระบบ (Commissioning) การทดสอบแบบครบวงจรของมิเตอร์แต่ละตัวผ่านฐานข้อมูลย้อนหลังไปจนถึงแม่แบบรายงาน จะไม่มีการลงนามรับมอบไซต์ใดจนกว่ารายงานในรูปแบบ ISO 50001 จะทำงานได้อย่างราบรื่น
- การดำเนินงานและการปรับปรุง การทบทวนรายไตรมาส การปรับจูนการตรวจจับความผิดปกติ และการรีเฟรชค่าฐาน
มีแดชบอร์ดตัวอย่างและแม่แบบรายงานให้บริการเมื่อมีการร้องขอ
คำถามที่พบบ่อย
อะไรคือความแตกต่างระหว่าง EMS กับ BMS? BMS ควบคุม HVAC แสงสว่าง และการเข้าถึง ส่วน EMS วัดและรายงานเกี่ยวกับพลังงาน ทั้งสองระบบเชื่อมต่อกัน โดยมักผ่าน BACnet/IP แต่ BMS ตัดสินใจแบบเรียลไทม์ ขณะที่ EMS ผลิตหลักฐานตลอดช่วงเวลา
ฉันจำเป็นต้องมีการรับรอง ISO 50001 เพื่อติดตั้ง EMS หรือไม่? ไม่จำเป็น หลายไซต์ติดตั้ง EMS เพื่อควบคุมต้นทุนหรือเพื่อ BCA Green Mark เพียงอย่างเดียว ISO 50001 เป็นกรอบการทำงานในกรณีที่นักลงทุน คำสั่งจากสำนักงานใหญ่ หรือข้อกำหนดในการประมูลกำหนดให้ต้องมีการรับรองอย่างเป็นทางการ
ข้อมูลจาก EMS สามารถนำไปใช้รายงาน ESG ได้หรือไม่? ได้ การปล่อยก๊าซ Scope 2 ในกรอบ ESG ที่ใช้กันทั่วไป (GRI, SASB, TCFD, ISSB) คำนวณมาจากการใช้พลังงาน kWh คูณด้วยค่าแฟกเตอร์การปล่อยก๊าซของโครงข่ายไฟฟ้า EMS ส่งออกค่า kWh ทีมความยั่งยืนของคุณนำค่าแฟกเตอร์มาใช้ และฝ่ายการเงินลงนามในการเปิดเผยข้อมูล
ไซต์ขนาดเล็กแค่ไหนถึงจะเล็กเกินไปสำหรับ EMS? ค่าสาธารณูปโภครายเดือนราว SGD 5,000 ถึง 10,000 เริ่มที่จะคุ้มค่ากับการวัดย่อย หากต่ำกว่านั้น การบันทึกด้วยมือและการติดตามด้วยสเปรดชีตมักจะถูกกว่า
การติดตั้งใช้เวลานานเท่าใด? กรอบเวลาโดยทั่วไป: สี่ถึงสิบสองสัปดาห์นับจากการเริ่มโครงการจนถึงฐานข้อมูลย้อนหลังที่ทำงานได้จริงสำหรับไซต์เชิงพาณิชย์ขนาดกลาง และสามถึงเก้าเดือนสำหรับไซต์อุตสาหกรรมที่ใช้สาธารณูปโภคหลายประเภทพร้อมการรายงาน ISO 50001 ที่เชื่อมต่อครบถ้วน
พูดคุยกับทีมพลังงานของ EcoXplore
บริการทบทวนหน้างาน ข้อเสนอเชิงงบประมาณ และการนำชมรายงานตัวอย่างมีให้บริการจาก หน้าติดต่อ EcoXplore สำหรับการประเมินเบื้องต้นของ BCA Green Mark โดยเฉพาะ ดู คู่มือการตรวจติดตามพลังงาน Green Mark โดยเฉพาะ
Energy Management System (EMS): ISO 50001, BCA Green Mark dan Apa yang Sebenarnya Dipantau Sebuah EMS
Energi adalah satu-satunya pos pada sebagian besar buku besar fasilitas yang berubah setiap hari, diukur oleh pihak lain, dan dikonsumsi oleh peralatan yang jarang dikendalikan oleh tim fasilitas. Sebuah Energy Management System (EMS) adalah platform data-dan-proses yang mengubah aliran yang tidak transparan ini menjadi anggaran yang terkelola.
Halaman ini membahas apa yang dilakukan EMS pada lapisan perangkat keras dan perangkat lunak, bagaimana standar ISO 50001 membingkai pekerjaan ini, rezim kepatuhan yang disuplai oleh data EMS di Singapura dan kawasan yang lebih luas, serta bagaimana EcoXplore menerapkan dan mengoperasikan program EMS.
Apa yang sebenarnya dilakukan EMS
Sebuah EMS menggabungkan empat fungsi:
- Submetering. Pengukuran granular atas listrik, air, udara, gas, dan uap (W.A.G.E.S) pada titik-titik di hilir meter pendapatan utilitas. Tanpa submetering, sebuah program energi hanya dapat mengatribusikan konsumsi ke keseluruhan bangunan.
- Agregasi dan historian. Basis data deret waktu yang menyimpan data meter beserta tag rekayasa dan hierarki aset yang digunakan tim operasi (chiller-1, AHU-3, tenant-A).
- Dasbor dan laporan. Tampilan KPI untuk operator pabrik, ringkasan bulanan untuk manajer senior, pengajuan tahunan untuk badan kepatuhan.
- Deteksi anomali. Peringatan ketika sebuah baseline dilanggar atau ketika profil beban bergeser dengan cara yang mengindikasikan degradasi.
Urutannya penting. Tanpa submetering yang baik, dasbor berbohong. Tanpa historian, deteksi anomali tidak memiliki jendela pembanding. Banyak proyek EMS gagal pada langkah pertama karena daftar titik meter difinalisasi sebelum pola konsumsi dipahami.
ISO 50001: apa yang dituntut standar ini dari lapisan data
ISO 50001:2018 membingkai manajemen energi sebagai siklus perbaikan berkelanjutan mengikuti pola plan-do-check-act yang sama dengan ISO 9001 dan ISO 14001. Kewajiban pada lapisan data bersifat konkret:
- Tinjauan energi. Analisis terdokumentasi atas penggunaan energi yang signifikan (SEUs), konsumsi masa lalu, dan variabel yang mendorongnya (volume produksi, cuaca, okupansi).
- Baseline energi (EnB). Periode referensi yang menjadi dasar pengukuran kinerja. Baseline harus dapat dipertahankan, dengan variabel yang memengaruhi konsumsi dinormalisasi secara matematis, bukan sekadar dilewatkan begitu saja.
- Indikator kinerja energi (EnPIs). Angka-angka yang memungkinkan kinerja dilacak. kWh per unit produksi adalah contoh klasik; kWh per meter persegi per cooling degree day lebih jujur untuk bangunan.
- Rencana aksi dan pelacakan. Proyek perbaikan terdokumentasi dengan target terukur, dan proses untuk mengukur apakah target tersebut tercapai.
- Audit internal dan tinjauan manajemen. Bukti bahwa sistem benar-benar digunakan.
Sebuah EMS yang tidak mendukung normalisasi EnPIs terhadap variabel pendorong tidak cukup untuk mempertahankan sertifikasi ISO 50001, terlepas dari seberapa menarik dasbornya. Pembeli sebaiknya meminta vendor mendemonstrasikan mesin regresi dan normalisasinya, bukan hanya pustaka grafiknya.
Lapisan perangkat keras
Sebuah tumpukan perangkat keras EMS yang khas untuk lokasi industri berukuran menengah:
- Meter listrik Class 0.5 pada titik asupan utama dan setiap papan distribusi utama. Class 0.5 berarti akurasi dalam rentang ±0.5% dari pembacaan; ini setara dengan IEC 62053-22 Class 0.5S.
- Current transformer (CTs). Split-core untuk retrofit, solid-core untuk pembangunan baru. Rasio CT menentukan rentang pengukuran; CT yang berukuran terlalu besar mengorbankan akurasi beban rendah.
- Modbus RTU / TCP, BACnet/IP, atau M-Bus sebagai protokol lapangan. BACnet/IP lebih disukai jika EMS akan terintegrasi dengan Building Management System.
- Flow meter untuk air, udara terkompresi, dan uap, yang dimensinya disesuaikan dengan pipa dan rentang aliran yang diharapkan.
- Meter gas di tempat gas alam atau LPG dikonsumsi; untuk pelaporan lingkungan, meter ini perlu mendukung kompensasi tekanan dan suhu.
- Gateway / edge controller yang menarik data dari protokol lapangan dan meneruskannya ke historian.
Untuk cakupan W.A.G.E.S di lokasi yang mengonsumsi kelima utilitas, sebuah kilang kecil mungkin menjalankan 60 hingga 120 titik pengukuran; sebuah kantor komersial mungkin menjalankan 15 hingga 30.
Lapisan perangkat lunak
Tumpukan perangkat lunak terbagi menjadi tiga tingkat:
Historian. Penyimpanan deret waktu yang menangani ledakan tag dengan baik. Pilihan umum: backend SQL bawaan vendor, OSIsoft PI untuk lokasi yang lebih besar, InfluxDB atau TimescaleDB untuk pembangunan cloud-native.
Dasbor. Tampilan langsung untuk operasi, papan ringkasan untuk manajemen, dan layar detail untuk insinyur yang melacak aset tertentu. Dasbor yang baik menolak menampilkan angka yang tidak didukung data dasarnya; dasbor yang buruk merata-ratakan interval kosong dan diam-diam menyesatkan.
Laporan. Ekspor berulang untuk tinjauan manajemen ISO 50001, pengajuan BCA Green Mark, pengungkapan iklim MAS, dan inventaris GHG Scope 2. Masing-masing memiliki persyaratan templatnya sendiri, dan penerapan EMS yang dikirim tanpa ini terpasang cenderung dikuotasi ulang dalam waktu setahun.
EMS vs PQMS: catatan singkat
Sebuah EMS mengukur konsumsi; sebuah Power Quality Monitoring System (PQMS) mengukur kualitas pasokan. Keduanya berbagi meter pendapatan jika perangkat kerasnya mendukung kedua fungsi tersebut, tetapi laporan dan standarnya berbeda. Untuk pembahasan yang lebih lengkap, lihat EMS vs PQMS: apa yang dipantau masing-masing.
Rezim kepatuhan yang disuplai data EMS
Di Singapura saja, sebuah EMS menyuplai setidaknya tiga aliran pelaporan:
- BCA Green Mark NRB:2015 (serta varian Healthcare 2019 dan Data Centre 2019) mensyaratkan submetering pada granularitas yang ditentukan. Meter tingkat tenant, pengelompokan sirkuit pencahayaan, dan submetering pada chiller plant adalah temuan audit yang umum. Lihat panduan pemantauan energi BCA Green Mark.
- MAS Guidelines on Environmental Risk Management berlaku untuk lembaga keuangan dan semakin berlaku untuk mitra mereka. Emisi Scope 2 diturunkan dari angka kWh EMS.
- Pelaporan GHG Protocol Scope 2 (baik berbasis lokasi maupun berbasis pasar) mensyaratkan konsumsi kWh per tahun, per wilayah jaringan, dengan dukungan dokumentasi.
Di seluruh kawasan:
- Thailand: target DEDE (Department of Alternative Energy Development and Efficiency) dan studi TEFC (Thailand Energy Efficiency Centre) menggunakan data EMS.
- Indonesia: KESDM Permen 33/2023 menetapkan persyaratan manajemen energi untuk pengguna yang ditetapkan.
- Malaysia: SEDA dan EMEER 2008 menetapkan persyaratan manajemen yang efisien untuk instalasi yang melebihi 3,000,000 kWh per enam bulan.
- Vietnam: MOIT Energy Efficiency Law 50/2010 dan circular 19/2016 menetapkan kewajiban bagi konsumen energi yang ditetapkan.
Pendekatan EcoXplore
EcoXplore merancang dan membangun program EMS di seputar kewajiban kepatuhan pelanggan, bukan katalog meter. Keterlibatan standarnya:
- Tinjauan pra-penerapan. Identifikasi laporan yang harus dihasilkan EMS, lalu bekerja mundur menuju daftar titik meter. Sering kali memunculkan celah submetering yang akan menggagalkan audit di kemudian hari.
- Desain daftar titik. Gambar, konvensi penamaan, hierarki aset yang selaras dengan struktur tag yang sudah ada pada tim operasi.
- Pengadaan dan instalasi. Pembangunan BCA L4 dengan kendali lingkungan ISO 14001 pada pekerjaan di lokasi.
- Commissioning. Pengujian menyeluruh atas setiap meter mulai dari historian hingga template laporan. Tidak ada lokasi yang ditandatangani selesai sampai laporan berformat ISO 50001 berjalan dengan bersih.
- Operasikan dan perbaiki. Tinjauan triwulanan, penyetelan anomali, penyegaran baseline.
Contoh dasbor dan template laporan tersedia atas permintaan.
Pertanyaan yang sering diajukan
Apa perbedaan antara EMS dan BMS? Sebuah BMS mengendalikan HVAC, pencahayaan, dan akses. Sebuah EMS mengukur dan melaporkan energi. Keduanya terintegrasi, sering kali melalui BACnet/IP, tetapi BMS membuat keputusan secara real time sedangkan EMS menghasilkan bukti dari waktu ke waktu.
Apakah saya memerlukan sertifikasi ISO 50001 untuk menerapkan EMS? Tidak. Banyak lokasi menerapkan EMS hanya untuk pengendalian biaya atau BCA Green Mark. ISO 50001 adalah kerangka kerja jika sertifikasi formal disyaratkan oleh investor, mandat kantor pusat, atau persyaratan tender.
Dapatkah data EMS digunakan untuk pelaporan ESG? Ya. Emisi Scope 2 dalam kerangka ESG umum mana pun (GRI, SASB, TCFD, ISSB) diturunkan dari konsumsi kWh dikalikan faktor emisi jaringan. EMS mengekspor kWh, tim keberlanjutan Anda menerapkan faktornya, keuangan menandatangani pengungkapannya.
Seberapa kecil sebuah lokasi terlalu kecil untuk EMS? Tagihan utilitas bulanan sekitar SGD 5,000 hingga 10,000 mulai membenarkan submetering. Di bawah itu, catatan manual dan pelacakan spreadsheet biasanya lebih murah.
Berapa lama penerapan berlangsung? Linimasa khas: empat hingga dua belas minggu dari kickoff hingga historian yang aktif untuk lokasi komersial berukuran menengah; tiga hingga sembilan bulan untuk lokasi industri multi-utilitas dengan pelaporan ISO 50001 lengkap yang sudah terpasang.
Bicara dengan tim energi EcoXplore
Tinjauan lokasi, proposal anggaran, dan penelusuran contoh laporan tersedia dari halaman kontak EcoXplore. Untuk pra-asesmen BCA Green Mark secara khusus, lihat panduan pemantauan energi Green Mark yang khusus membahasnya.
Hệ thống Quản lý Năng lượng (EMS): ISO 50001, BCA Green Mark và những gì một EMS thực sự theo dõi
Năng lượng là khoản mục duy nhất trên hầu hết sổ sách chi phí của một cơ sở vừa biến động hằng ngày, vừa được đo bởi một bên khác, lại vừa được tiêu thụ bởi thiết bị mà đội ngũ quản lý cơ sở hiếm khi kiểm soát. Một Hệ thống Quản lý Năng lượng (EMS) là nền tảng dữ liệu và quy trình biến dòng chảy mờ mịt này thành một ngân sách được quản lý.
Trang này trình bày một EMS làm gì ở các lớp phần cứng và phần mềm, cách tiêu chuẩn ISO 50001 định hình công việc, các chế độ tuân thủ mà dữ liệu EMS phục vụ tại Singapore và khu vực rộng hơn, cùng cách EcoXplore triển khai và vận hành các chương trình EMS.
Một EMS thực sự làm gì
Một EMS kết hợp bốn chức năng:
- Đo phụ (Submetering). Đo lường chi tiết điện, nước, khí nén, gas và hơi nước (W.A.G.E.S) tại các điểm nằm sau công tơ doanh thu của đơn vị cung cấp tiện ích. Nếu không có đo phụ, một chương trình năng lượng chỉ có thể quy mức tiêu thụ cho toàn bộ tòa nhà.
- Tổng hợp và lưu trữ lịch sử (historian). Một cơ sở dữ liệu chuỗi thời gian lưu trữ dữ liệu công tơ kèm theo các thẻ kỹ thuật và cấu trúc phân cấp tài sản mà đội vận hành làm việc cùng (chiller-1, AHU-3, tenant-A).
- Bảng điều khiển và báo cáo. Khung nhìn KPI cho người vận hành nhà máy, báo cáo tóm tắt hằng tháng cho lãnh đạo cấp cao, và bản nộp hằng năm cho các cơ quan tuân thủ.
- Phát hiện bất thường. Cảnh báo khi một mức chuẩn (baseline) bị vượt qua hoặc khi một biểu đồ phụ tải dịch chuyển theo cách gợi ý sự xuống cấp.
Thứ tự rất quan trọng. Không có đo phụ tốt, bảng điều khiển sẽ nói dối. Không có lưu trữ lịch sử, việc phát hiện bất thường không có cửa sổ so sánh. Nhiều dự án EMS thất bại ngay ở bước đầu tiên vì danh sách điểm đo đã được chốt trước khi hiểu được mô hình tiêu thụ.
ISO 50001: tiêu chuẩn yêu cầu gì từ lớp dữ liệu
ISO 50001:2018 định hình quản lý năng lượng như một vòng lặp cải tiến liên tục theo cùng mô hình plan-do-check-act như ISO 9001 và ISO 14001. Các nghĩa vụ ở lớp dữ liệu rất cụ thể:
- Đánh giá năng lượng (Energy review). Một phân tích được lập thành văn bản về các hạng mục sử dụng năng lượng đáng kể (SEUs), mức tiêu thụ trong quá khứ, và các biến số chi phối nó (sản lượng sản xuất, thời tiết, mức độ sử dụng).
- Đường cơ sở năng lượng (EnB). Một giai đoạn tham chiếu để đo lường hiệu suất so với nó. Đường cơ sở phải có thể bảo vệ được, với các biến số ảnh hưởng đến mức tiêu thụ được chuẩn hóa bằng toán học, chứ không phải nói qua loa.
- Các chỉ số hiệu suất năng lượng (EnPIs). Những con số cho phép theo dõi hiệu suất. kWh trên mỗi đơn vị sản xuất là ví dụ kinh điển; kWh trên mỗi mét vuông trên mỗi ngày-độ làm mát thì trung thực hơn đối với các tòa nhà.
- Kế hoạch hành động và theo dõi. Các dự án cải tiến được lập thành văn bản với mục tiêu đo lường được, và một quy trình để đo xem các mục tiêu đó có đạt được hay không.
- Đánh giá nội bộ và rà soát của lãnh đạo. Bằng chứng cho thấy hệ thống đang được sử dụng.
Một EMS không hỗ trợ việc chuẩn hóa EnPIs theo các biến số chi phối thì không đủ để duy trì chứng nhận ISO 50001, bất kể bảng điều khiển có hấp dẫn đến đâu. Người mua nên yêu cầu nhà cung cấp trình diễn công cụ hồi quy và chuẩn hóa, chứ không chỉ thư viện biểu đồ.
Lớp phần cứng
Một ngăn xếp phần cứng EMS điển hình cho một địa điểm công nghiệp cỡ vừa:
- Công tơ điện Class 0.5 tại điểm đầu vào chính và mỗi tủ phân phối lớn. Class 0.5 nghĩa là độ chính xác trong phạm vi ±0.5% giá trị đọc; điều này tương ứng với IEC 62053-22 Class 0.5S.
- Biến dòng (CTs). Loại lõi chẻ cho cải tạo, loại lõi đặc cho công trình mới. Tỷ số CT quyết định dải đo; CT quá lớn sẽ hy sinh độ chính xác ở tải thấp.
- Modbus RTU / TCP, BACnet/IP, hoặc M-Bus làm giao thức hiện trường. BACnet/IP được ưu tiên khi EMS sẽ tích hợp với một Hệ thống Quản lý Tòa nhà (Building Management System).
- Đồng hồ đo lưu lượng cho nước, khí nén và hơi nước, được chọn kích cỡ theo đường ống và dải lưu lượng dự kiến.
- Đồng hồ đo gas nơi tiêu thụ khí thiên nhiên hoặc LPG; đối với báo cáo môi trường, các đồng hồ này cần hỗ trợ bù áp suất và nhiệt độ.
- Bộ điều khiển cổng / biên (gateway / edge controller) kéo dữ liệu từ các giao thức hiện trường và chuyển tiếp đến bộ lưu trữ lịch sử.
Để bao phủ W.A.G.E.S tại các địa điểm tiêu thụ cả năm loại tiện ích, một nhà máy lọc nhỏ có thể chạy 60 đến 120 điểm đo; một văn phòng thương mại có thể chạy 15 đến 30.
Lớp phần mềm
Ngăn xếp phần mềm chia thành ba tầng:
Lưu trữ lịch sử (Historian). Bộ lưu trữ chuỗi thời gian xử lý mượt mà sự bùng nổ về số lượng thẻ. Các lựa chọn phổ biến: backend SQL đi kèm theo nhà cung cấp, OSIsoft PI cho các địa điểm lớn hơn, InfluxDB hoặc TimescaleDB cho các bản dựng cloud-native.
Bảng điều khiển. Màn hình trực tiếp cho vận hành, bảng tóm tắt cho ban quản lý, và màn hình chi tiết cho kỹ sư theo dõi các tài sản cụ thể. Bảng điều khiển tốt từ chối hiển thị những con số mà dữ liệu nền không hỗ trợ; bảng điều khiển tồi lấy trung bình trên các khoảng giá trị null và âm thầm gây hiểu lầm.
Báo cáo. Các bản xuất định kỳ cho rà soát của lãnh đạo theo ISO 50001, bản nộp BCA Green Mark, công bố khí hậu của MAS, và bảng kiểm kê GHG Scope 2. Mỗi loại có yêu cầu mẫu riêng, và các triển khai EMS xuất xưởng mà không tích hợp sẵn những thứ này thường bị báo giá lại trong vòng một năm.
EMS so với PQMS: một lưu ý ngắn
Một EMS đo mức tiêu thụ; một Hệ thống Giám sát Chất lượng Điện năng (PQMS) đo chất lượng của nguồn cung cấp. Chúng dùng chung công tơ doanh thu nơi phần cứng hỗ trợ cả hai chức năng, nhưng các báo cáo và tiêu chuẩn thì khác nhau. Để thảo luận đầy đủ hơn, xem EMS so với PQMS: mỗi hệ thống giám sát những gì.
Các chế độ tuân thủ mà dữ liệu EMS phục vụ
Chỉ riêng tại Singapore, một EMS phục vụ ít nhất ba luồng báo cáo:
- BCA Green Mark NRB:2015 (cùng các biến thể Healthcare 2019 và Data Centre 2019) yêu cầu đo phụ ở mức độ chi tiết được quy định. Công tơ cấp người thuê, nhóm mạch chiếu sáng, và đo phụ cho cụm chiller là những phát hiện kiểm toán phổ biến. Xem hướng dẫn giám sát năng lượng BCA Green Mark.
- Hướng dẫn của MAS về Quản lý Rủi ro Môi trường áp dụng cho các tổ chức tài chính và ngày càng áp dụng cho các đối tác của họ. Phát thải Scope 2 được suy ra từ số liệu kWh của EMS.
- Báo cáo GHG Protocol Scope 2 (cả theo địa điểm và theo thị trường) yêu cầu mức tiêu thụ kWh theo năm, theo vùng lưới điện, kèm chứng từ hỗ trợ.
Trên toàn khu vực:
- Thái Lan: Các mục tiêu của DEDE (Department of Alternative Energy Development and Efficiency) và các nghiên cứu của TEFC (Thailand Energy Efficiency Centre) sử dụng dữ liệu EMS.
- Indonesia: KESDM Permen 33/2023 đặt ra các yêu cầu quản lý năng lượng cho những người dùng được chỉ định.
- Malaysia: SEDA và EMEER 2008 đặt ra các yêu cầu quản lý hiệu quả cho các cơ sở vượt quá 3,000,000 kWh trong mỗi sáu tháng.
- Việt Nam: Luật Sử dụng Năng lượng Tiết kiệm và Hiệu quả 50/2010 của MOIT và thông tư 19/2016 đặt ra nghĩa vụ cho các cơ sở sử dụng năng lượng trọng điểm.
Cách tiếp cận của EcoXplore
EcoXplore thiết kế và xây dựng các chương trình EMS xoay quanh nghĩa vụ tuân thủ của khách hàng, chứ không phải xoay quanh danh mục công tơ. Phạm vi tiêu chuẩn:
- Rà soát trước triển khai. Xác định các báo cáo mà EMS phải tạo ra, rồi làm ngược lại tới danh sách điểm đo. Thường làm lộ ra các lỗ hổng đo phụ mà lẽ ra đã không vượt qua kiểm toán sau này.
- Thiết kế danh sách điểm đo. Bản vẽ, quy ước đặt tên, cấu trúc phân cấp tài sản được căn chỉnh theo cấu trúc thẻ hiện có của đội vận hành.
- Mua sắm và lắp đặt. Các bản dựng BCA L4 với kiểm soát môi trường ISO 14001 trong công tác thi công tại hiện trường.
- Nghiệm thu (Commissioning). Kiểm tra đầu cuối từng công tơ thông qua bộ lưu trữ lịch sử đến các mẫu báo cáo. Không địa điểm nào được nghiệm thu cho đến khi các báo cáo theo định dạng ISO 50001 chạy trơn tru.
- Vận hành và cải tiến. Rà soát hằng quý, tinh chỉnh phát hiện bất thường, làm mới đường cơ sở.
Các bảng điều khiển mẫu và mẫu báo cáo có sẵn theo yêu cầu.
Câu hỏi thường gặp
Sự khác biệt giữa một EMS và một BMS là gì? Một BMS điều khiển HVAC, chiếu sáng và kiểm soát ra vào. Một EMS đo lường và báo cáo về năng lượng. Hai hệ thống tích hợp với nhau, thường thông qua BACnet/IP, nhưng BMS ra quyết định theo thời gian thực còn EMS tạo ra bằng chứng theo thời gian.
Tôi có cần chứng nhận ISO 50001 để triển khai một EMS không? Không. Nhiều địa điểm triển khai EMS chỉ để kiểm soát chi phí hoặc cho BCA Green Mark. ISO 50001 là khung làm việc nếu việc chứng nhận chính thức được yêu cầu bởi một nhà đầu tư, một chỉ thị của trụ sở chính, hoặc một yêu cầu đấu thầu.
Dữ liệu EMS có thể được dùng cho báo cáo ESG không? Có. Phát thải Scope 2 trong bất kỳ khung ESG phổ biến nào (GRI, SASB, TCFD, ISSB) đều được suy ra từ mức tiêu thụ kWh nhân với một hệ số phát thải của lưới điện. EMS xuất ra kWh, đội ngũ phát triển bền vững của bạn áp dụng hệ số, bộ phận tài chính ký xác nhận công bố.
Một địa điểm nhỏ đến mức nào thì quá nhỏ cho một EMS? Một hóa đơn tiện ích hằng tháng khoảng SGD 5,000 đến 10,000 bắt đầu biện minh được cho việc đo phụ. Dưới mức đó, nhật ký thủ công và theo dõi bằng bảng tính thường rẻ hơn.
Việc triển khai mất bao lâu? Tiến độ điển hình: bốn đến mười hai tuần từ khi khởi động đến khi có bộ lưu trữ lịch sử hoạt động cho một địa điểm thương mại cỡ vừa; ba đến chín tháng cho một địa điểm công nghiệp đa tiện ích với báo cáo ISO 50001 đầy đủ được tích hợp.
Trao đổi với đội ngũ năng lượng của EcoXplore
Các buổi rà soát địa điểm, đề xuất ngân sách, và hướng dẫn xem qua báo cáo mẫu có sẵn từ trang liên hệ của EcoXplore. Riêng đối với đánh giá sơ bộ BCA Green Mark, xem hướng dẫn giám sát năng lượng Green Mark chuyên biệt.
More About Ecoxplore
We are dedicated to empowering businesses with software and services that drive efficiency and growth
View more

.svg)

.svg)

.svg)
.svg)

More About Ecoxplore
We are dedicated to empowering businesses with software and services that drive efficiency and growth
View moreข้อมูลเพิ่มเติมเกี่ยวกับ Ecoxplore
เรามุ่งมั่นในการช่วยให้ธุรกิจของคุณทำงานได้อย่างมีประสิทธิภาพและเติบโตอย่างยั่งยืนด้วยซอฟต์แวร์และบริการของเรา
ดูเพิ่มเติมMore About Ecoxplore
We are dedicated to empowering businesses with software and services that drive efficiency and growth
View moreLebih Banyak Tentang Ecoxplore
Kami berdedikasi untuk memberdayakan bisnis dengan perangkat lunak dan layanan yang mendorong efisiensi dan pertumbuhan
Lihat lebih banyakMore About Ecoxplore
We are dedicated to empowering businesses with software and services that drive efficiency and growth
View moreLebih Banyak Tentang Ecoxplore
Kami berdedikasi untuk memberdayakan bisnis melalui perangkat lunak dan layanan yang mendorong efisiensi serta pertumbuhan.
Lihat selengkapnyaMore About Ecoxplore
We are dedicated to empowering businesses with software and services that drive efficiency and growth
View moreHiểu thêm về Ecoxplore
Chúng tôi cam kết trao quyền cho các doanh nghiệp bằng phần mềm và dịch vụ giúp tăng cường hiệu quả và phát triển
Xem thêm